The technical indicators are located in the bullish area, with the MACD stretching further above its red signal line and the RSI moving towards the 70 level. Yet, if the latter jumps in the overbought zone, it could also be an indication that the rally is overdone, and hence negative corrections should not be a surprise in coming sessions.
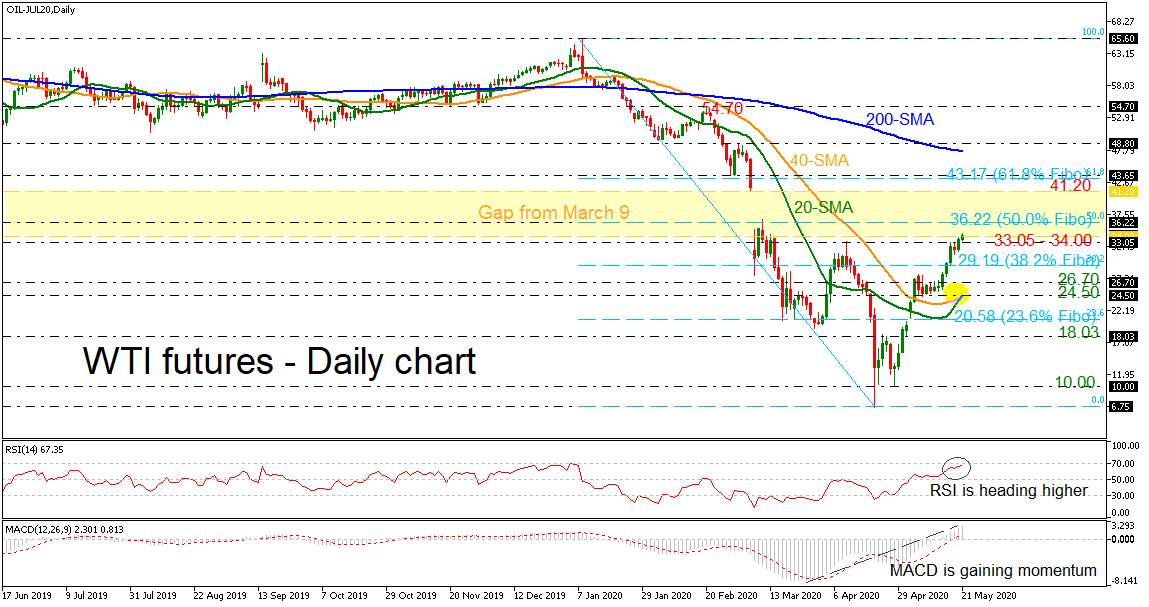
Traders may be eagerly looking for a break above today’s ten-week top at 34.41 to increase buying orders. If that’s the case, the rally could last until the 50.0% Fibonacci retracement level of the down leg from 65.60 to 6.75 at 36.22. If bullish forces appear even stronger, 41.20 should be another resistance to keep in mind ahead of the 61.8% Fibonacci at 43.17.
Should the price retreat, immediate support would come from the 33.05 – 34.00 area. Moving lower, the focus will shift to the 38.2% Fibo of 29.19, while lower still, a violation of the 24.50 – 26.70 region, which overlaps with the bullish cross of the short-term SMAs, would increase speculation that the bullish phase has ended, and a neutral mode is in progress. Below that, the 20.58 barrier, being the 23.6% Fibo, may pause bearish actions.
风险提示:本文所述仅代表作者个人观点,不代表 Followme 的官方立场。Followme 不对内容的准确性、完整性或可靠性作出任何保证,对于基于该内容所采取的任何行为,不承担任何责任,除非另有书面明确说明。


加载失败()