Gold (XAU/USD) managed to break above the previous top at $1,911 – dating back to September 2011. The new all-time high was created surprisingly easily with no real battle from the bears at the resistance area. Is there any direction but up at the moment?
Price Charts and Technical Analysis
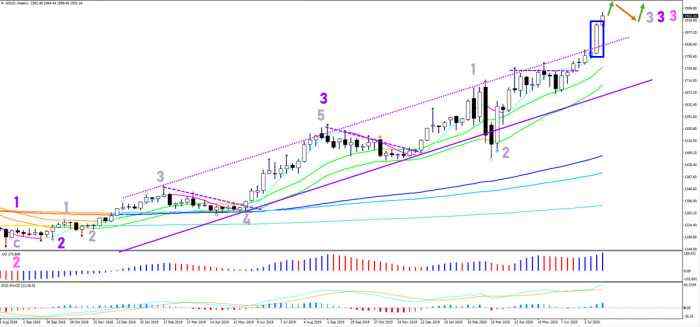
The weekly candlestick from last week closed extremely bullish (close near the high). But the candle was large as well indicating lots of volatility and momentum. It also clearly broke above the channel top and the previous top without any hesitation. The bullish price action seems to confirm the development of various waves 3 on the weekly chart. More upside is therefore likely, although some type of correction (flag or triangle) could place eventually.
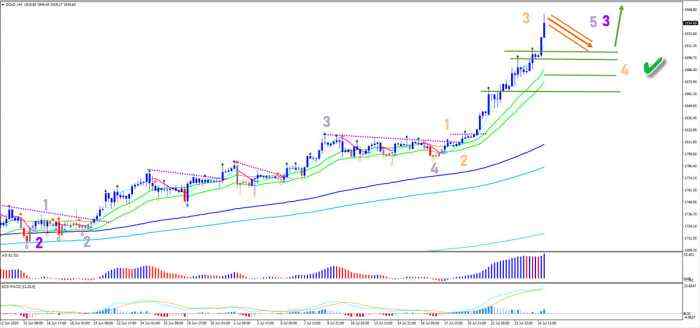
The 4 hour Gold chart shows how much bullish momentum the price swing is showing. The angle of the moving averages (MAs) are very steep and pull away significantly from the long-term MAs. This is typical for a wave 3 (orange) pattern and the momentum could push it higher. But as a trader, it might be better to wave for a wave 4 pattern back to support. A bounce at the support zone (green) is very likely at the moment.
风险提示:本文所述仅代表作者个人观点,不代表 Followme 的官方立场。Followme 不对内容的准确性、完整性或可靠性作出任何保证,对于基于该内容所采取的任何行为,不承担任何责任,除非另有书面明确说明。

暂无评论,立马抢沙发