EUR/USD price action has fluctuated within a broad 200-pip trading range after the major currency pair topped out at the 1.19-handle. The Euro still trades considerably higher relative to its US Dollar counterpart, currently up about 10% since EUR/USD based around the 1.08-price level three months ago, but the bloc currency has started to surrender some of those gains.
EUR/USD PRICE CHART: DAILY TIME FRAME (01 MAY TO 11 AUGUST 2020)

As Euro strength starts to ebb, which is indicated by the falling relative strength index, it seems that EUR/USD bulls are losing conviction. This follows a potential double top pattern at the 1.1900-mark. Spot EUR/USD price action now hovers below its downward-sloping 8-day moving average.
This technical barrier could suggest a bearish bias may be developing as the short-term trend starts to point lower. That said, interim technical support appears to align with month-to-date lows residing roughly around the 1.1700-handle before the medium-term 34-day moving average comes into focus as a potential downside target for EUR/USD bears.
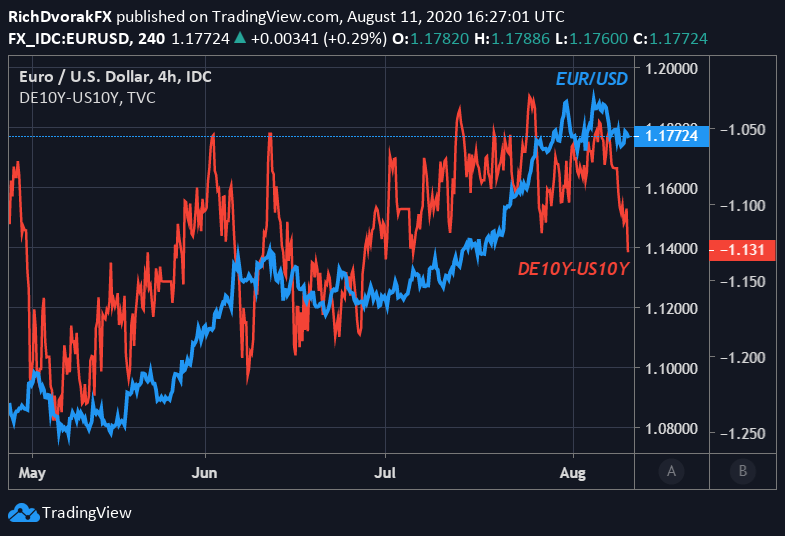
EUR/USD PRICE CHART: 4-HOUR TIME FRAME (29 APRIL TO 11 AUGUST 2020)
Reprinted from dailyfx, the copyright all reserved by the original author.
风险提示:本文所述仅代表作者个人观点,不代表 Followme 的官方立场。Followme 不对内容的准确性、完整性或可靠性作出任何保证,对于基于该内容所采取的任何行为,不承担任何责任,除非另有书面明确说明。


加载失败()