Market Overview
AUD/USD is off the six-day highs, but trades better bid above 0.7040 after upbeat Australian
Capex and Chinese Industrial Profits data. The Aussie emerged as the biggest G10 gainers on
Wednesday. US GDP and Fed Chair’s Powell’s speech in focus.
Gold is nursing moderate losses at press time, having gained 1.3% on Wednesday. The losses
could be reversed during the day ahead as the daily chart is reporting a bullish reversal pattern.
The market has gone from being indecisive to bullish.
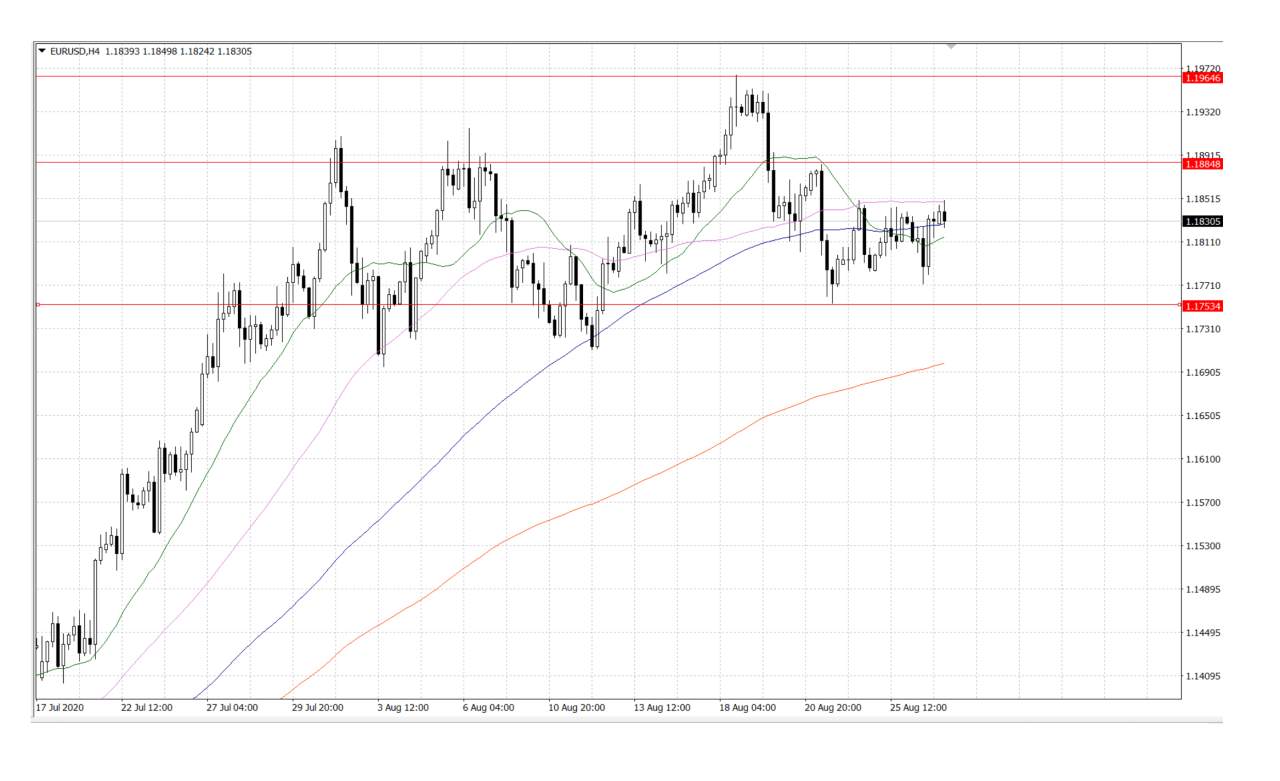
EUR/USD
The EUR/USD pair has spent yet another day inside the range defined last Friday. The 4-hour
chart offers a neutral stance, as the pair has been seesawing around its 20 and 100 SMA, which
remain flat.
Technical indicators, in the meantime, stand around their midlines, also lacking clear directional
strength. Overall, the risk is skewed to the downside, although a firmer bearish extension will
be likely on a break below 1.1750, where the pair met buyers by the end of last week.
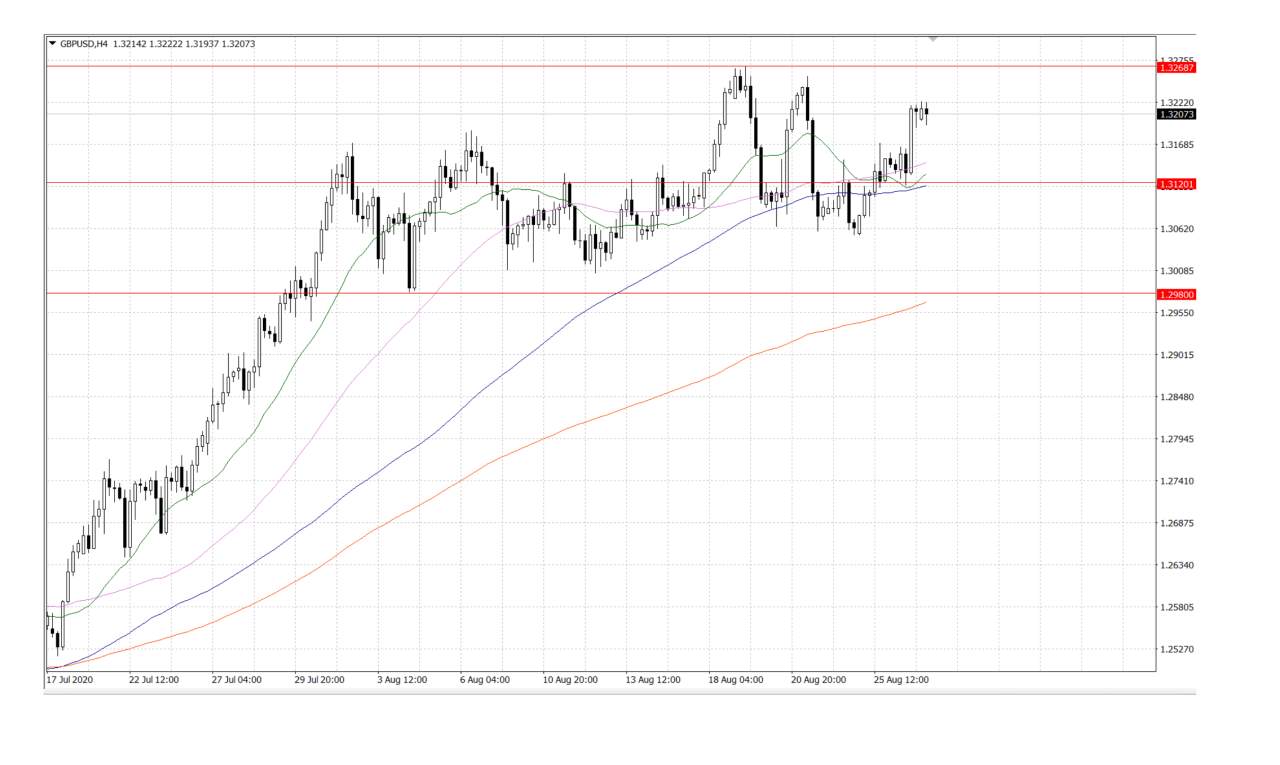
GBP/USD
The GBP/USD pair is near the upper end of its latest range, yet still inside its monthly range. In
the 4-hour chart, the pair has managed to advance above its moving averages, although the 20
and 100 SMA remain directionless and converging around 1.3120.
Technical indicators advanced within positive levels but already lost their upward strength,
indicating decreasing buying interest at the current levels. The resistance awaits at 1.3270.
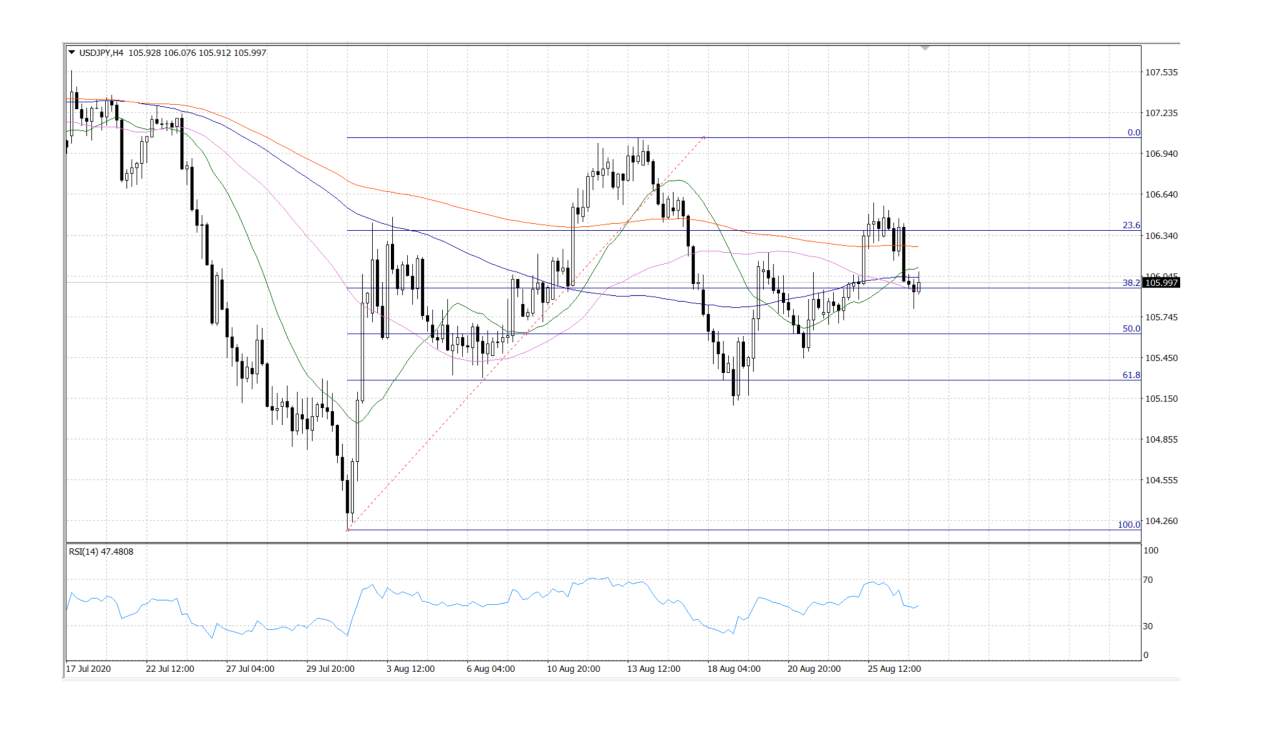
USD/JPY
The USD/JPY pair has lost its positive momentum and retreated below the 38.2% retracement
of its latest daily decline. In the 4-hour chart, the pair is once again trading below all of its
moving averages, which anyway remain directionless and inside quite a tight range.
Technical indicators eased from their recent highs, with the Momentum now stable around its
100 level and the RSI at around 47, skewing the risk to the downside. The support is near
105.60; while the resistance awaits at 106.35.
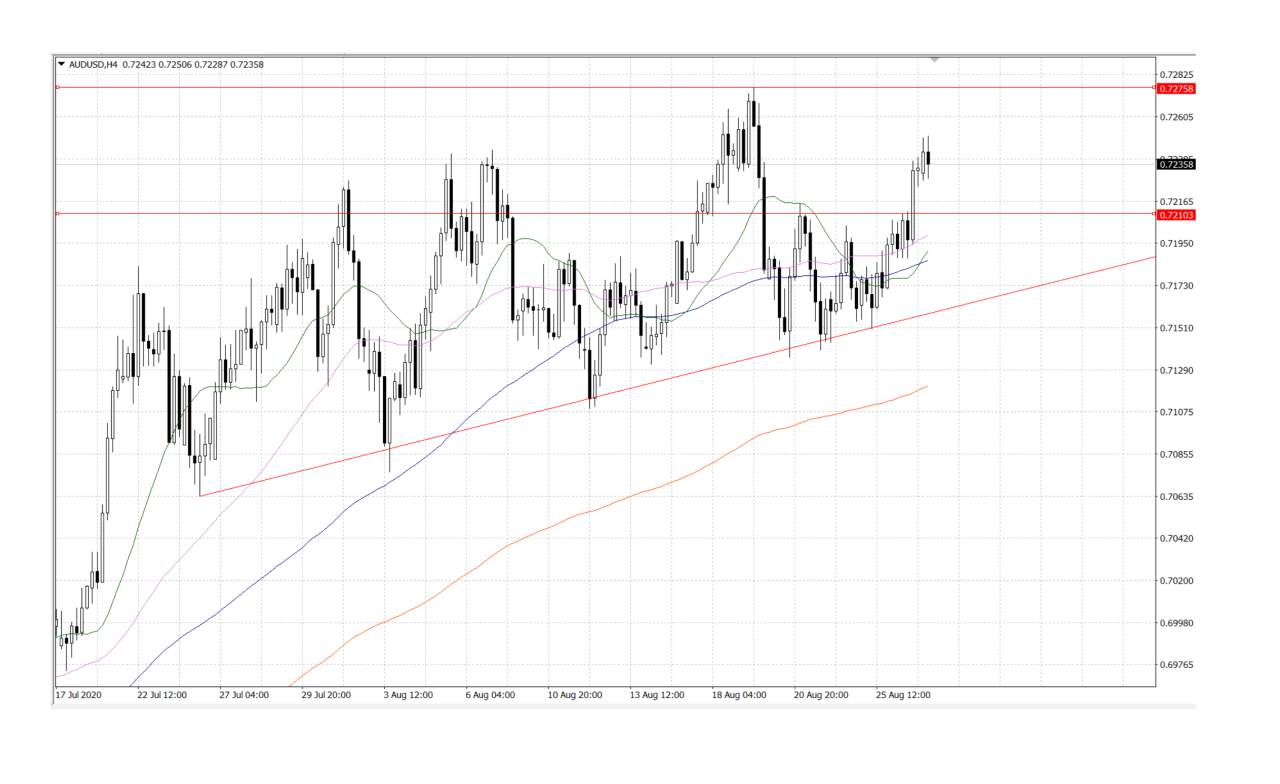
AUD/USD
The AUD/USD pair has an increased bullish potential, mainly considering that it´s trading near
its yearly highs. Technical readings, however, fell short of confirming a bullish continuation. In
the 4-hour chart, the pair has settled above all of its moving averages, with the 20 and 100 SMA
still converging and without directional strength.
Technical indicators hold within positive levels but turned lower ahead of the US close. Still, the
pair has room to test its yearly high and even break above it during the upcoming sessions.
The support is near 0.7210. the pair has a strong resistance at 0.7275 in the day.
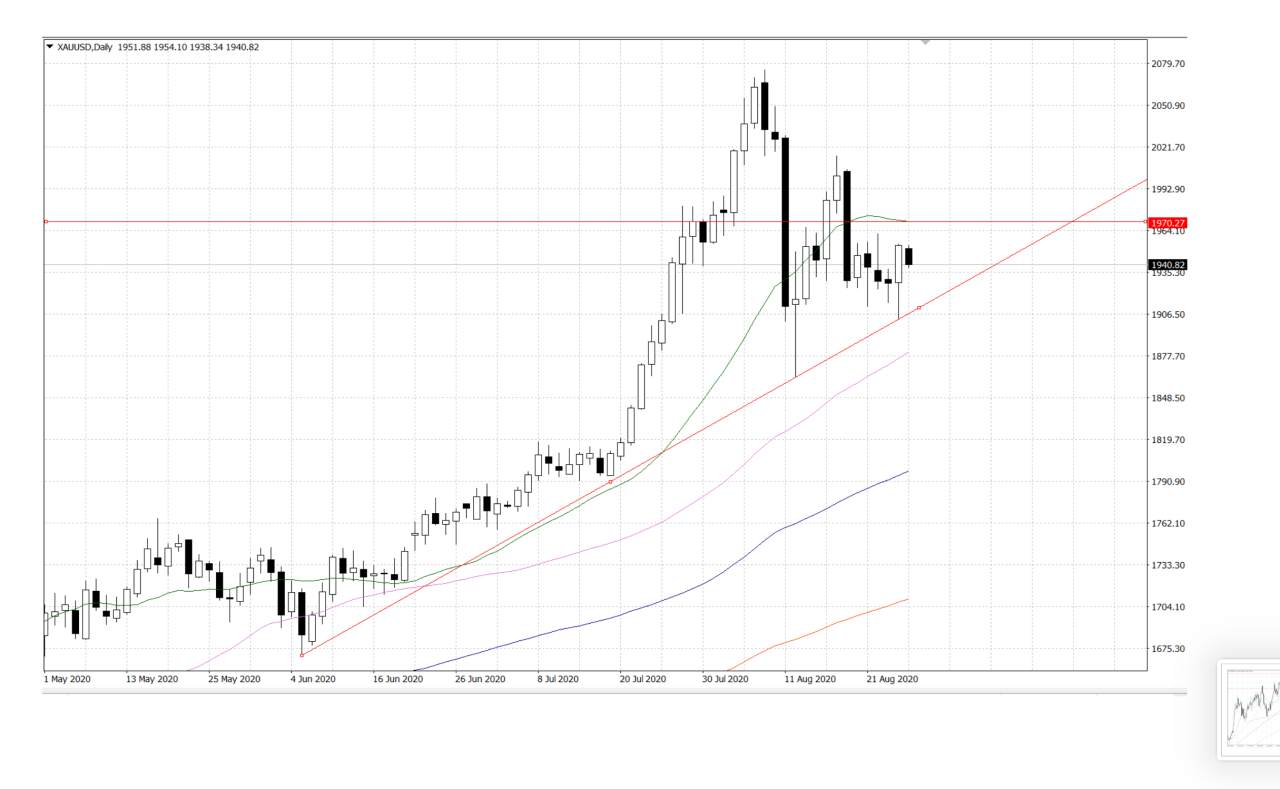
XAUUSD
The metal’s sustained bounce off an ascending trend line from June 5th, currently around $1,906,
keeps the buyers hopeful. As a result, a monthly falling trend line near $1,958 could become their
immediate choice to break ahead of a 20-day SMA level of $1,971.
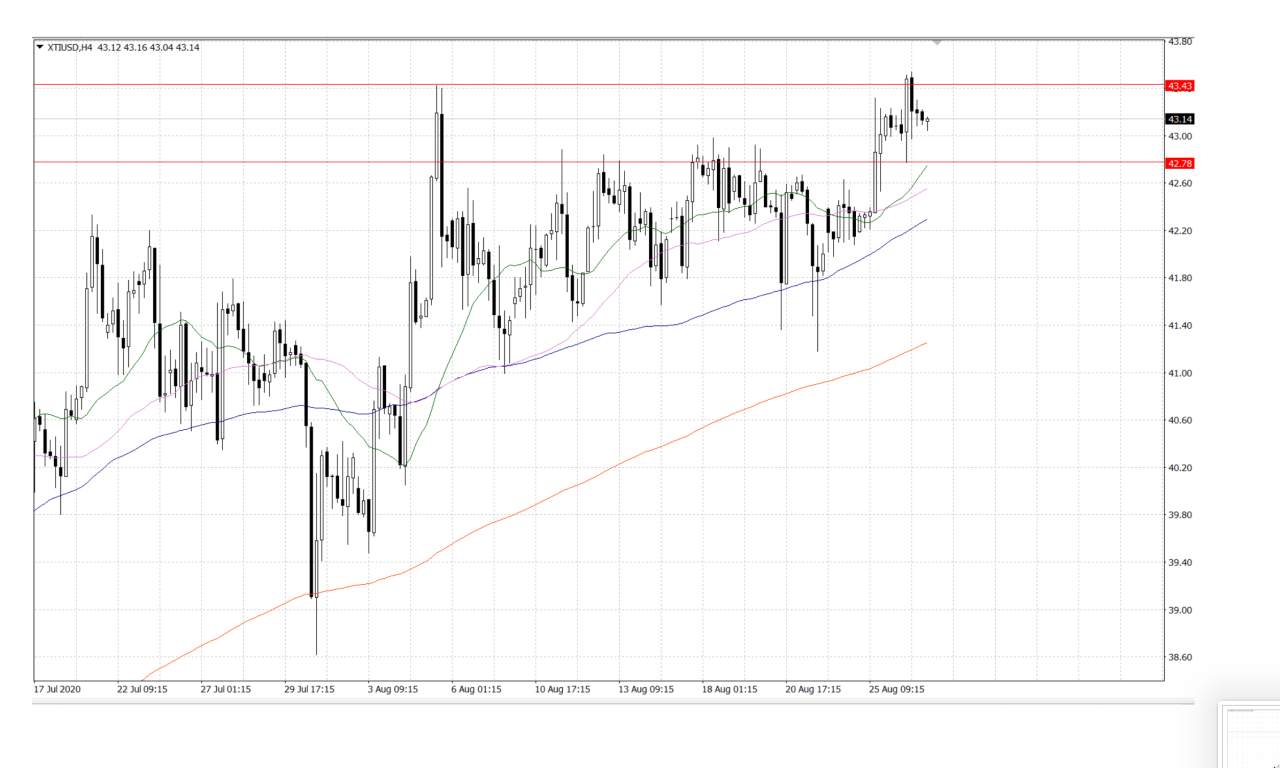
XTIUSD
The black metal reached the five-month high at $43.54. While February month’s low near $44.00
becomes the immediate concern of buyers, the sellers may enter if the prices fail to stay past-
$43.00. The support now is at $42.77.
风险提示:本文所述仅代表作者个人观点,不代表 Followme 的官方立场。Followme 不对内容的准确性、完整性或可靠性作出任何保证,对于基于该内容所采取的任何行为,不承担任何责任,除非另有书面明确说明。

暂无评论,立马抢沙发