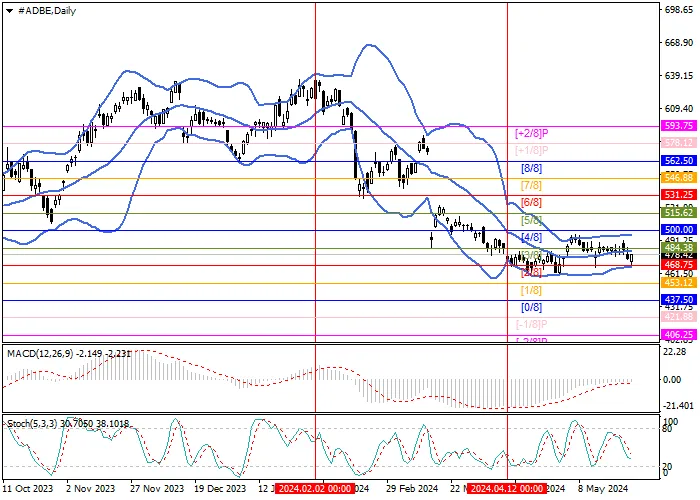
| Scenario | |
|---|---|
| Timeframe | Weekly |
| Recommendation | SELL STOP |
| Entry Point | 468.70 |
| Take Profit | 437.50, 406.25 |
| Stop Loss | 487.00 |
| Key Levels | 406.25, 437.50, 468.75, 500.00, 531.25, 562.50 |
| Alternative scenario | |
|---|---|
| Recommendation | BUY STOP |
| Entry Point | 500.05 |
| Take Profit | 531.25, 562.50 |
| Stop Loss | 475.00 |
| Key Levels | 406.25, 437.50, 468.75, 500.00, 531.25, 562.50 |
Current trend
Shares of Adobe Inc., a leading American software developer, have stabilized after a three-month decline and have been trading for the third week in a sideways range of 500.00–468.75 (Murrey level [4/8]-[2/8]): the quotes are trying to overcome its lower limit to reach area 437.50 (Murrey level [0/8]) and 406.25 (Murrey level [–2/8]). A consolidation above the key “bullish” Murrey’s trading range of 500.00 (Murrey level [4/8]) will cause the asset to return to the area of 531.25 (Murrey level [6/8]) and 562.50 (Murrey level [8/8]). The market situation remains uncertain, and a significant price movement will only be possible after it leaves the sideways range of 500.00–468.75.
Technical indicators do not give a single signal: Bollinger Bands are horizontal, the MACD histogram is at the zero line, its volumes are insignificant, and Stochastic is directed downwards.
Support and resistance
Resistance levels: 500.00, 531.25, 562.50.
Support levels: 468.75, 437.50, 406.25.

Trading tips
Short positions may be opened below 468.75, with the targets at 437.50, 406.25, and stop loss 487.00. Implementation time: 5–7 days.
Long positions may be opened above 500.00, with the targets at 531.25, 562.50, and stop loss 475.00.
风险提示:以上内容仅代表作者或嘉宾的观点,不代表 FOLLOWME 的任何观点及立场,且不代表 FOLLOWME 同意其说法或描述,也不构成任何投资建议。对于访问者根据 FOLLOWME 社区提供的信息所做出的一切行为,除非另有明确的书面承诺文件,否则本社区不承担任何形式的责任。
FOLLOWME 交易社区网址: www.followme.ceo

