| Scenario | |
|---|---|
| Timeframe | Weekly |
| Recommendation | BUY STOP |
| Entry Point | 2390.0 |
| Take Profit | 2450.0 |
| Stop Loss | 2360.0 |
| Key Levels | 2280.0, 2340.0, 2390.0, 2450.0 |
| Alternative scenario | |
|---|---|
| Recommendation | SELL STOP |
| Entry Point | 2340.0 |
| Take Profit | 2280.0 |
| Stop Loss | 2380.0 |
| Key Levels | 2280.0, 2340.0, 2390.0, 2450.0 |
Current trend
The XAU/USD pair stays above 2300.0, supported by high demand from global central banks and trading platforms.
US Fed officials do not plan to switch to a “dovish” course before the end of the summer, and the forecast from the Chicago Mercantile Exchange (CME) FedWatch Instrument suggests a 4.7% probability of cutting interest rates at the meeting on July 31. The main reason for the change in expectations was the rhetoric of the head of the regulator, Jerome Powell, who said there is not enough positive data to begin active steps to change the course. In addition, he confirmed that the labor market is no longer overheated, and the economy is returning to pre-crisis levels of 2019 despite inflation remaining above the target of 2.0%. Tomorrow at 14:30 (GMT 2), the consumer price index data is due. The June indicator may adjust from 3.3% to 3.1% YoY and increase from 0.0% to 0.1% MoM.
Another reason for the stable dynamics of the quotes is Chinese statistics. Over the past two months, gold supplies to the country have been suspended, and reserves have been consolidated at 2.264K tons. Some experts assume that the government continues to import but does not report this. It may indicate an intention to purchase more gold than before, following the trend set by global central banks, which are actively replenishing their reserves. Thus, the National Bank of Poland increased gold volumes by 4.0 tons in June, while India purchased 9.0 tons, and now the country’s reserves amount to 841.0 tons.
As for the trading volumes on the Chicago Mercantile Exchange (CME Group), there are signals about new large positions formation. Since July 3, the value has increased from 235.0K to 336.7K, exceeding the average spring figures.
Support and resistance
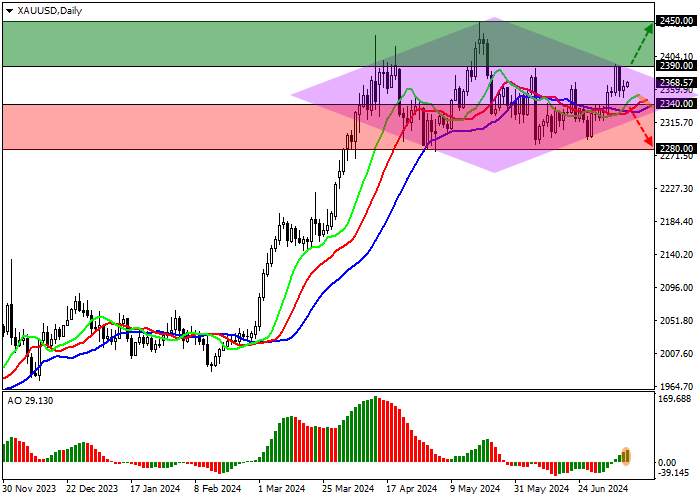
On the daily chart, the trading instrument is correcting within the Diamond pattern with boundaries of 2400.0–2310.0.
Technical indicators keep an unstable buy signal. Fast EMA on the Alligator indicator are above the signal line, and the AO histogram forms ascending bars above the transition level.
Resistance levels: 2390.0, 2450.0.
Support levels: 2340.0, 2280.0.

Trading tips
Long positions may be opened after the price grows and consolidates above the 2390.0 level, with the target at 2450.0. Stop loss — 2360.0. Implementation period: 7 days or more.
Short positions may be opened after the price declines and consolidates below 2340.0, with the target at 2280.0. Stop loss — 2380.0.
风险提示:以上内容仅代表作者或嘉宾的观点,不代表 FOLLOWME 的任何观点及立场,且不代表 FOLLOWME 同意其说法或描述,也不构成任何投资建议。对于访问者根据 FOLLOWME 社区提供的信息所做出的一切行为,除非另有明确的书面承诺文件,否则本社区不承担任何形式的责任。
FOLLOWME 交易社区网址: www.followme.ceo


加载失败()