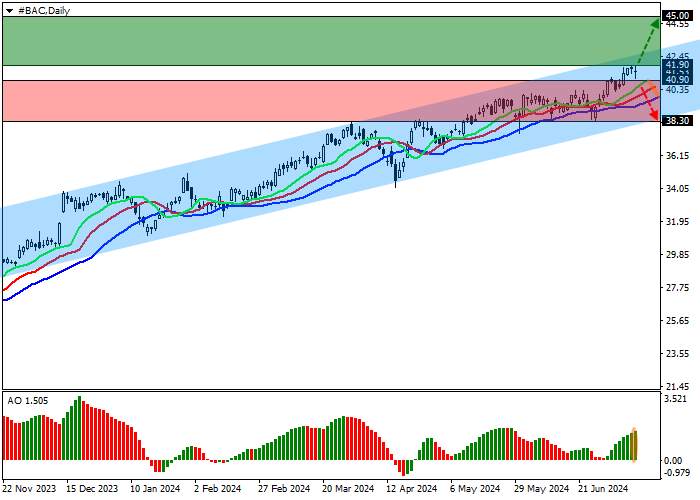
Shares of Bank of America Corp., one of the largest banks and analytical agencies in the United States, are trading within the corrective trend at the level of 41.00.
On the daily chart, the price is retreating from the support line of the ascending channel with a dynamic limit of 43.50-38.30, preparing to leave the channel.
On the four-hour time frame, holding above the yearly high at 41.00 allowed quotes to increase the probability of reaching the channel resistance line at 43.50, but for full growth, they need to overcome the current high at 42.00.
Technical indicators are strengthening the buy signal: the fast EMA on the “Alligator” indicator is above the signal line, keeping the oscillation range stable, and the AO chart forms corrective bars above the transition level.
Trading tips
Long positions can be opened after the price rises and stabilizes above the level of 41.90 with a target of 45.00. Stop loss - 41.00. Implementation period: 7 days or more.
Short positions can be opened after the price falls and stabilizes below the level of 40.90 with a target of 38.30. Stop loss - 42.00.


加载失败()