
| Scenario | |
|---|---|
| Timeframe | Weekly |
| Recommendation | BUY STOP |
| Entry Point | 20700.0 |
| Take Profit | 21530.0 |
| Stop Loss | 20300.0 |
| Key Levels | 19500.0, 20180.0, 20700.0, 21530.0 |
| Alternative scenario | |
|---|---|
| Recommendation | SELL STOP |
| Entry Point | 20180.0 |
| Take Profit | 19500.0 |
| Stop Loss | 20400.0 |
| Key Levels | 19500.0, 20180.0, 20700.0, 21530.0 |
Current trend
One of the leading US indices, the NQ 100, is showing positive dynamics, which is largely due to a correction in the bond market and expectations regarding the corporate reporting period that started last week.
The results of banking sector companies were published on Friday. Financial holding JPMorgan Chase & Co. reported revenue of 50.2 billion dollars, the highest in the company's history, exceeding analysts' expectations of 41.72 billion dollars, and Wells Fargo & Co. managed to exceed preliminary estimates of 20.22 billion dollars and record revenue in the region of 20.69 billion dollars.
Today, traders will pay attention to statistics from investment bank Goldman Sachs Group Inc., which may report revenue of 12.35 billion dollars after 10.9 billion dollars in the same period a year earlier, and BlackRock Inc., which is likely to increase the figure from 4.46 billion dollars to 4.85 billion dollars.
Additional support for NQ 100 quotes is provided by the situation on the bond market, where the downward correction continues: the 10-year bonds are trading at 4.236%, down from 4.284% midweek, the 20-year bonds yield is 4.507% after 4.565% previously, and the 30-year bonds yield is down to 4.400% from 4.445%.
The growth leaders in the index are Arm Holdings ADR ( 4.60%), ON Semiconductor Corp. ( 3.54%), MercadoLibre Inc. ( 3.08%), Zscaler Inc. ( 3.05%).
Among the leaders of the decline are Biogen Inc. (–2.85%), Meta Platforms Inc. (–2.72%), Diamondback Energy Inc. (–1.41%).
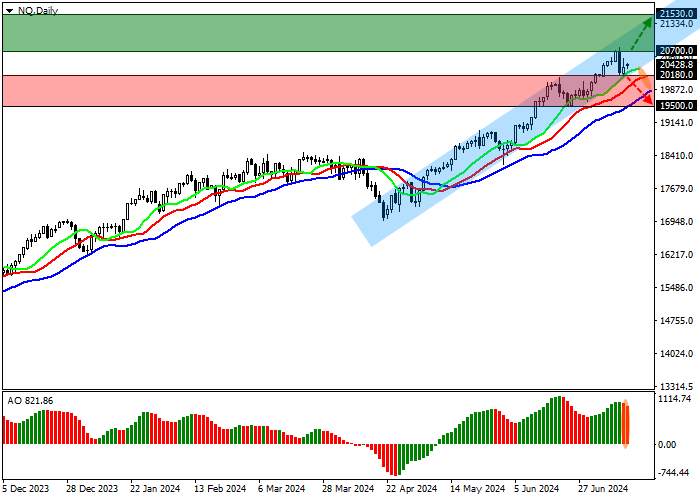
Support and resistance
On the daily chart, the index quotes continue to correct, moving away from the support line of the ascending channel with boundaries of 21500.0–20500.0.
Technical indicators are holding a buy signal, which is gradually strengthening: fast EMAs on the Alligator indicator are still moving away from the signal line, and the AO histogram is forming new upward bars, rising in the buy zone.
Support levels: 20180.0, 19500.0.
Resistance levels: 20700.0, 21530.0.
Trading tips
If the price consolidates above 20700.0, it is worth opening long positions with a target of 21530.0. Stop-loss — 20300.0. Implementation time: 7 days and more.
Short positions can be opened after a reversal and beginning of the corrective decline in the asset, as well as consolidation of the price below the level of 20180.00 with the target of 19500.00. Stop-loss — 20400.0.
风险提示:本文所述仅代表作者个人观点,不代表 Followme 的官方立场。Followme 不对内容的准确性、完整性或可靠性作出任何保证,对于基于该内容所采取的任何行为,不承担任何责任,除非另有书面明确说明。


加载失败()