
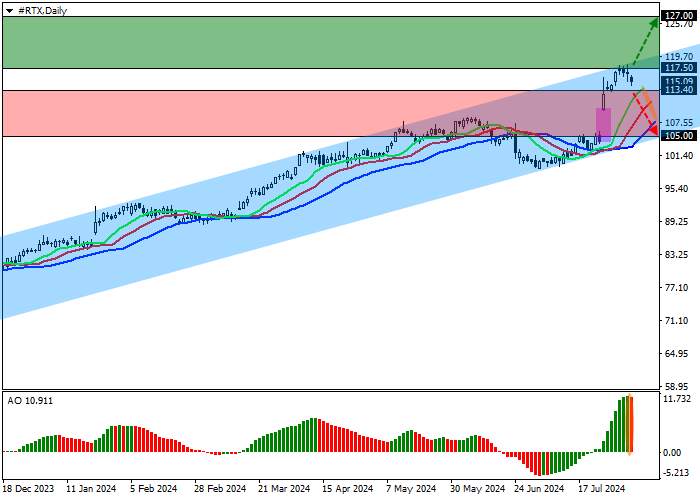
| Scenario | |
|---|---|
| Timeframe | Weekly |
| Recommendation | BUY STOP |
| Entry Point | 117.50 |
| Take Profit | 127.00 |
| Stop Loss | 114.00 |
| Key Levels | 104.00, 105.00, 109.70, 113.40, 115.00, 117.50, 118.00, 120.00, 127.00 |
| Alternative scenario | |
|---|---|
| Recommendation | SELL STOP |
| Entry Point | 113.40 |
| Take Profit | 105.00 |
| Stop Loss | 116.00 |
| Key Levels | 104.00, 105.00, 109.70, 113.40, 115.00, 117.50, 118.00, 120.00, 127.00 |
The shares of RTX Corp., an American aerospace and defense conglomerate, are trading at 115.00.
On the daily chart, the price is correcting upwards, holding below the resistance line of the ascending channel 120.00–104.00.
On the four-hour chart, this movement has turned into a trend, confirmed by the recent price gap of 109.70–104.00, which wasn’t worked out. The target for the trend may be an exit from the channel with the quotes consolidation above 118.00.
Technical indicators are holding the buy signal: the fast EMA on the Alligator indicator are above the signal line, and the AO histogram is forming correction bars in the buy zone.
Trading tips
Long positions may be opened after the price grows and consolidates above the 117.50 level, with the target at 127.00. Stop loss — 114.00. Implementation period: 7 days or more.
Short positions may be opened after the price declines and consolidates below 113.40, with the target at 105.00. Stop loss — 116.00.
风险提示:本文所述仅代表作者个人观点,不代表 Followme 的官方立场。Followme 不对内容的准确性、完整性或可靠性作出任何保证,对于基于该内容所采取的任何行为,不承担任何责任,除非另有书面明确说明。


加载失败()