Shares of Alcoa Corp., one of the largest aluminum producers, are correcting at 31.00.
On the daily chart, the price retreats from the lower border of the downward channel with dynamic boundaries of 34.00–28.00.
On the four-hour chart, the potential for further decline remains strong, and the current increase is one of two corrective waves, with the target at 33.50. After the end, the negative dynamics will continue. After a breakdown of last month’s low of 28.00, the quotes can reach the year’s low of 25.00.
Technical indicators maintain a sell signal: the EMA fluctuation range on the Alligator indicator is expanding downwards, and the AO histogram is forming downward bars in the sell zone.
Trading tips
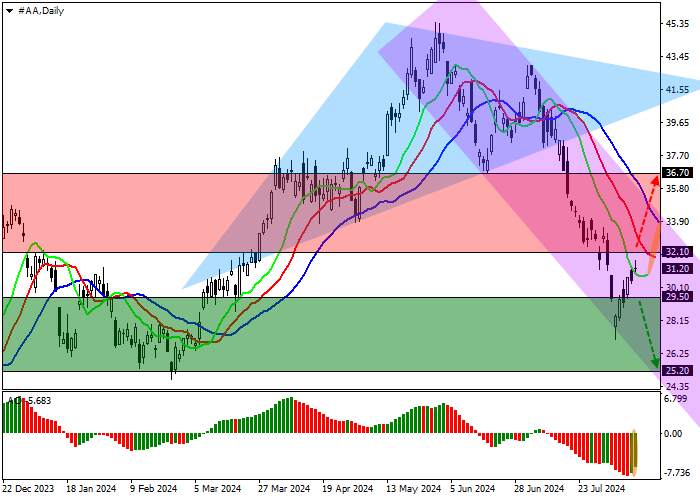
Short positions may be opened after the price declines and consolidates below 29.50, with the target at 25.20. Stop loss is around 31.00. Implementation period: 7 days or more.
Long positions may be opened after the price grows and consolidates above 32.10, with the target at 36.70. Stop loss — 30.00.


加载失败()