| Scenario | |
|---|---|
| Timeframe | Weekly |
| Recommendation | BUY STOP |
| Entry Point | 80.30 |
| Take Profit | 83.90 |
| Stop Loss | 79.00 |
| Key Levels | 74.90, 77.90, 80.30, 83.90 |
| Alternative scenario | |
|---|---|
| Recommendation | SELL STOP |
| Entry Point | 77.90 |
| Take Profit | 74.90 |
| Stop Loss | 79.00 |
| Key Levels | 74.90, 77.90, 80.30, 83.90 |
Current trend
Benchmark Brent Crude Oil prices are correcting in a poor downward trend, holding below 79.0 dollars per barrel.
The market remains uncertain, supported by both natural volatility caused by the dynamics of the American dollar and reports from countries that are leaders in oil production and processing. According to a study by the investment bank Goldman Sachs Group, the Saudi Arabian authorities intend to abandon the increase in investment in the oil sector gradually in favor of the development of renewable energy sources and mining. Thus, by 2028, expenses will be reduced by 40.0B dollars, and the volume of investments by 73.0%. The kingdom intends to diversify its economy, giving priority to the development of metallurgy, transport, and logistics, as well as digitalization. According to the Vision 2030 transformation program developed by Crown Prince Mohammed bin Salman al-Saud, one of the country’s key goals will be to reduce dependence on the sale of raw materials. According to the Ministry of Economy of Saudi Arabia, at the end of last year, the contribution of the oil sector to the economy amounted to 453.3B dollars, and a reduction in this value by 40.0B dollars in the future will certainly lead to a decrease in production volumes by a key market player.
As for the investment demand for contracts, according to the latest report from the US Commodity Futures Trading Commission (CFTC), last week, the number of net speculative positions in crude oil increased to 231.5K from 222.3K previously, for the first time after three weeks of consecutive downward dynamics. However, to restore the balance, the volume of transactions must again exceed 285.0–290.0K of the previous growth.
Support and resistance
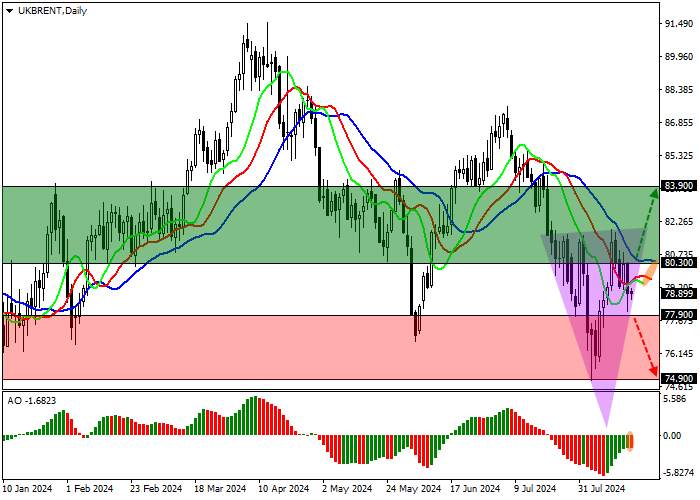
On the daily chart, the price is trading in a corrective trend, forming a possible reversal Head and shoulders pattern with the Neckline at 82.00.
Technical indicators maintain an unstable sell signal: the fast EMA of the Alligator indicator are approaching the signal line, and the histogram of the AO oscillator, being in the sell zone, is forming corrective bars.
Support levels: 77.90, 74.90.
Resistance levels: 80.30, 83.90.

Trading tips
Long positions may be opened after the price consolidates above the resistance level of 80.30, with the target at the local high of 83.90. Stop loss – 79.00. Implementation period: 7 days or more.
Short positions may be opened after the price consolidates below the support level of 77.90, with the target at 74.90. Stop loss – 79.00.
风险提示:以上内容仅代表作者或嘉宾的观点,不代表 FOLLOWME 的任何观点及立场,且不代表 FOLLOWME 同意其说法或描述,也不构成任何投资建议。对于访问者根据 FOLLOWME 社区提供的信息所做出的一切行为,除非另有明确的书面承诺文件,否则本社区不承担任何形式的责任。
FOLLOWME 交易社区网址: www.followme.ceo


加载失败()