
| Scenario | |
|---|---|
| Timeframe | Weekly |
| Recommendation | BUY STOP |
| Entry Point | 531.30 |
| Take Profit | 546.88, 562.50 |
| Stop Loss | 520.00 |
| Key Levels | 437.50, 468.75, 500.00, 531.25, 546.88, 562.50 |
| Alternative scenario | |
|---|---|
| Recommendation | BUY LIMIT |
| Entry Point | 500.00 |
| Take Profit | 546.88, 562.50 |
| Stop Loss | 488.00 |
| Key Levels | 437.50, 468.75, 500.00, 531.25, 546.88, 562.50 |
Current trend
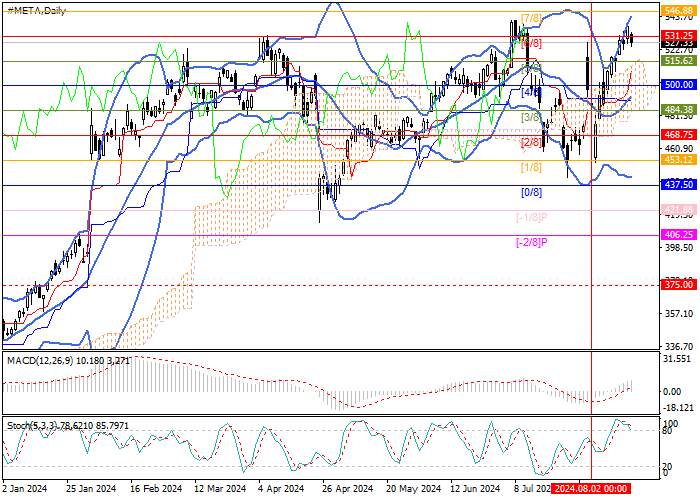
The shares of Meta Platforms Inc., an American transnational holding company that owns a technology conglomerate and the largest social network Facebook, have been actively increasing in value over the past two weeks. During this time, the price has reversed from 453.12 (Murrey level [1/8]), entered the positive zone, and is now testing the reversal mark of 531.25 (Murrey level [6/8]), consolidation above which will allow it to reach the targets of 546.88 (Murrey level [7/8]) and 562.50 (Murrey level [8/8]). A breakdown of the key “bearish” level of 500.00 (Murrey level [4/8]), supported by the middle line of Bollinger Bands, will act as a catalyst for a decline to the area of 468.75 (Murrey level [2/8]) and 437.50 (Murrey level [0/8]).
Technical indicators confirm the upward trend in the market: Bollinger Bands are reversing upwards, the MACD histogram is increasing in the positive zone, and Stochastic is preparing to leave the overbought zone, allowing a limited correction.
Support and resistance
Resistance levels: 531.25, 546.88, 562.50.
Support levels: 500.00, 468.75, 437.50.
Trading tips
Long positions may be opened above 531.25 or after a reversal at 500.00, with the targets at 546.88, and 562.50 and stop losses at 520.00 and 488.00, respectively. Implementation period: 5–7 days.
风险提示:本文所述仅代表作者个人观点,不代表 Followme 的官方立场。Followme 不对内容的准确性、完整性或可靠性作出任何保证,对于基于该内容所采取的任何行为,不承担任何责任,除非另有书面明确说明。


暂无评论,立马抢沙发