Shares of Verizon Communications Inc., one of the largest American telecommunications companies, are moving in a corrective trend at 41.00.
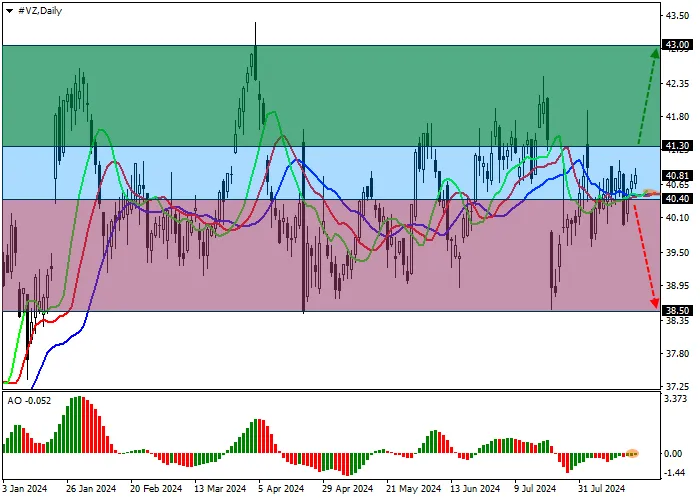
On the daily chart, the price consolidates in the middle of the sideways channel with boundaries of 43.00–38.50.
On the four-hour chart, after the price gap of 41.40–39.80 has formed, the price may try to continue moving toward the channel resistance line of 43.00. The most likely scenario now is consolidation above the mid-July high of 42.00.
Technical indicators have given a new buy signal: fast EMA on the Alligator indicator are again moving away from the signal line after crossing it a week earlier, and the AO oscillator histogram continues to build correction bars, being below the transition level.
Trading tips
Long positions may be opened after the price consolidates above the resistance level of 41.30, with the target at 43.00. Stop loss – 40.80. Implementation period: 7 days or more.
Short positions may be opened after the price consolidates below the support level of 40.40, with the target at 38.50. Stop loss – 41.00.


