
| Scenario | |
|---|---|
| Timeframe | Weekly |
| Recommendation | SELL STOP |
| Entry Point | 1.3610 |
| Take Profit | 1.3535, 1.3453 |
| Stop Loss | 1.3650 |
| Key Levels | 1.3453, 1.3535, 1.3610, 1.3793, 1.3855, 1.3916 |
| Alternative scenario | |
|---|---|
| Recommendation | BUY STOP |
| Entry Point | 1.3795 |
| Take Profit | 1.3855, 1.3916 |
| Stop Loss | 1.3750 |
| Key Levels | 1.3453, 1.3535, 1.3610, 1.3793, 1.3855, 1.3916 |
Current trend
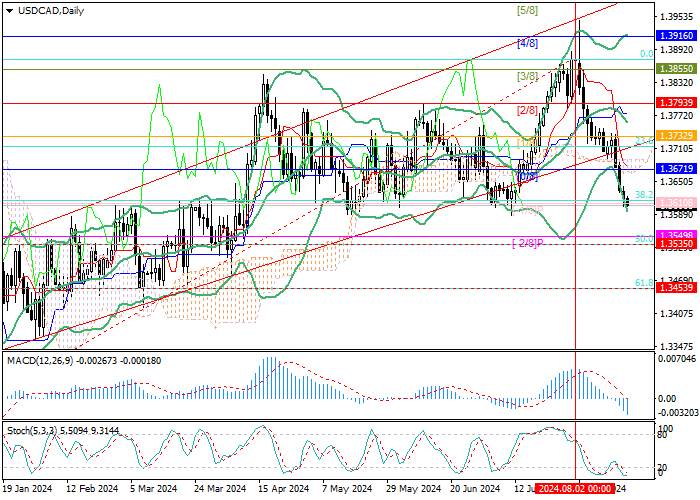
The USD/CAD pair has been actively declining since the beginning of August and is now trading around 1.3610 (Murrey level [–1/8]), remaining under pressure from the imminent change in the monetary rate in the US.
Currently, the main conditions for easing incentives have developed in the US economy. Inflation is steadily slowing, and unemployment is growing. Moreover, continuing the current policy may negatively affect economic conditions and increase the risks of recession, so most representatives of the US Fed are already openly supporting the transition to “dovish” rhetoric, and investors are wondering what volume of adjustment will ultimately be chosen. Thus, some believe the interest rate will be reduced by 25 basis points. Others are confident that the authorities will take a more radical step, reducing the value by 50 basis points at once. The speech of the head of the department, Jerome Powell, at the Economic Symposium in Jackson Hole will clarify the issue. He can not only confirm the September easing of monetary policy but also signal about the volume of adjustment.
In turn, the Bank of Canada has already changed the cost of borrowing twice, bringing the value to 4.50%. The July inflation data published yesterday once again confirmed the slowdown in price pressure. The index fell from 2.7% to 2.5% YoY, and the core indicator – from 1.9% to 1.7%, allowing monetary authorities to continue the “dovish” course, which may support the USD/CAD pair in the future.
Support and resistance
Technically, the pair has left the long-term ascending channel and is testing 1.3610 (Murrey level [–1/8], Fibonacci correction 38.2%). Consolidation below allows the price to reach 1.3535 (Fibonacci correction 50.0%) and 1.3453 (Fibonacci correction 61.8%). A breakout of the key “bullish” level of 1.3793 (Murrey level [2/8]) above the middle line of Bollinger bands will ensure growth to the area of 1.3855 (Murrey level [5/8]), 1.3916 (Murrey level [4/8]).
Technical indicators confirm a downward trend: Bollinger Bands are directed downwards, the MACD histogram is increasing in the negative zone, and Stochastic is in the oversold zone, not excluding a limited correction.
Resistance levels: 1.3793, 1.3855, 1.3916.
Support levels: 1.3610, 1.3535, 1.3453.
Trading tips
Short positions should be opened below 1.3610, with the targets at 1.3535, 1.3453, and stop loss 1.3650. Implementation period: 5–7 days.
Long positions may be opened above 1.3793, with the targets at 1.3855, 1.3916, and stop loss 1.3750.
风险提示:本文所述仅代表作者个人观点,不代表 Followme 的官方立场。Followme 不对内容的准确性、完整性或可靠性作出任何保证,对于基于该内容所采取的任何行为,不承担任何责任,除非另有书面明确说明。


加载失败()