| Scenario | |
|---|---|
| Timeframe | Weekly |
| Recommendation | BUY |
| Entry Point | 367.29 |
| Take Profit | 375.00, 382.81 |
| Stop Loss | 362.00 |
| Key Levels | 335.94, 343.75, 355.70, 367.19, 375.00, 382.81 |
| Alternative scenario | |
|---|---|
| Recommendation | SELL STOP |
| Entry Point | 355.65 |
| Take Profit | 343.75, 335.94 |
| Stop Loss | 364.00 |
| Key Levels | 335.94, 343.75, 355.70, 367.19, 375.00, 382.81 |
Current trend
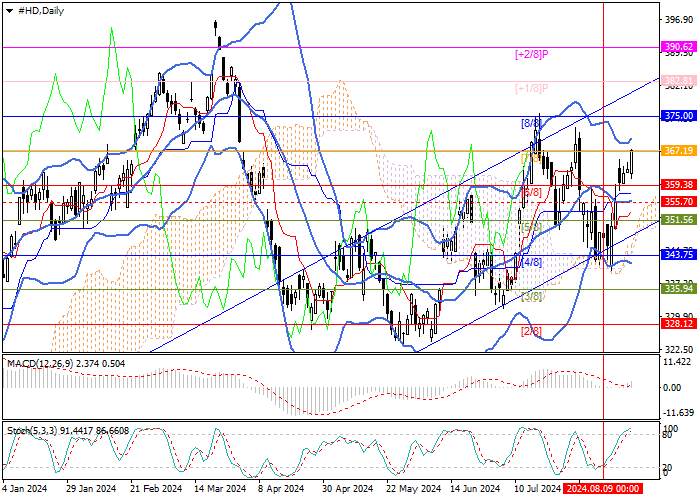
The Home Depot Inc., the largest home improvement company, resumed growth within a medium-term ascending channel after a correction to the 339.60 area, which was associated with the publication of poor financial statements for the second quarter last week, testing 367.19 (Murrey level [7/8]).
Management reported revenue of 43.18B dollars, below the forecast of 43.79B dollars, while adjusted earnings per share amounted to 4.67 dollars against preliminary estimates of 4.52 dollars. At the same time, sales declined for the seventh quarter in a row, this time by another 3.3%, reducing the average check by 1.8%. Experts note that the deterioration in the indicators occurred because buyers postponed large home improvement projects amid high interest rates and a reduction in their financial capabilities.
Now, traders are trying to predict the timing of the US Fed’s transition to a change in the vector of monetary policy since the rise in unemployment to 4.3% in July and the slowdown in inflation to 2.9%, justifying the step. A reduction in the cost of borrowing will give the American economy a new impetus for growth and contribute to the revival of domestic demand, which, in turn, will increase The Home Depot Inc.’s profit by the end of the year.
Support and resistance
Technically, the instrument is trading within a downward channel. Last week, the price tested its lower border but could not settle below and resumed growth. Now, the quotes are trying to overcome 367.19 (Murrey level [7/8]), consolidation above which will allow them to reach 375.00 (Murrey level [8/8]), 382.81 (Murrey level [ 1/8]). After a breakdown of the middle line of Bollinger bands of 355.70, the downward dynamics will intensify to 343.75 (Murrey level [4/8]) and 335.94 (Murrey level [3/8]).
Technical indicators do not give a single signal: Bollinger bands are horizontal, the MACD histogram is increasing in the positive zone, and Stochastic is directed upward but entered the overbought zone.
Resistance levels: 367.19, 375.00, 382.81.
Support levels: 355.70, 343.75, 335.94.

Trading tips
Long positions may be opened above 367.19, with the targets at 375.00, 382.81, and stop loss 362.00. Implementation period: 5–7 days.
Short positions may be opened below 355.70, with the targets at 343.75, 335.94 and stop loss 364.00.
风险提示:以上内容仅代表作者或嘉宾的观点,不代表 FOLLOWME 的任何观点及立场,且不代表 FOLLOWME 同意其说法或描述,也不构成任何投资建议。对于访问者根据 FOLLOWME 社区提供的信息所做出的一切行为,除非另有明确的书面承诺文件,否则本社区不承担任何形式的责任。
FOLLOWME 交易社区网址: www.followme.ceo


加载失败()