
| Scenario | |
|---|---|
| Timeframe | Weekly |
| Recommendation | BUY STOP |
| Entry Point | 165.60 |
| Take Profit | 175.00 |
| Stop Loss | 162.00 |
| Key Levels | 145.00, 154.20, 157.00, 162.00, 164.00, 175.00 |
| Alternative scenario | |
|---|---|
| Recommendation | SELL STOP |
| Entry Point | 162.50 |
| Take Profit | 154.20 |
| Stop Loss | 165.00 |
| Key Levels | 145.00, 154.20, 157.00, 162.00, 164.00, 175.00 |
The shares of Johnson & Johnson, one of the leading retail holdings, are correcting at 164.00.
On the daily chart, the price is holding above the resistance line of the ascending channel with dynamic boundaries of 157.00–145.00, preparing to continue growing.
On the four-hour chart, the quotes have almost reached the annual high of 165.00, and after consolidation above it, growth may continue to 175.00. The probability of a decline may develop only if the asset consolidates below 162.00.
Technical indicators maintain a buy signal: the EMA fluctuation range on the Alligator indicator is expanding in the direction of growth, and the AO histogram is forming correction bars above the transition level.
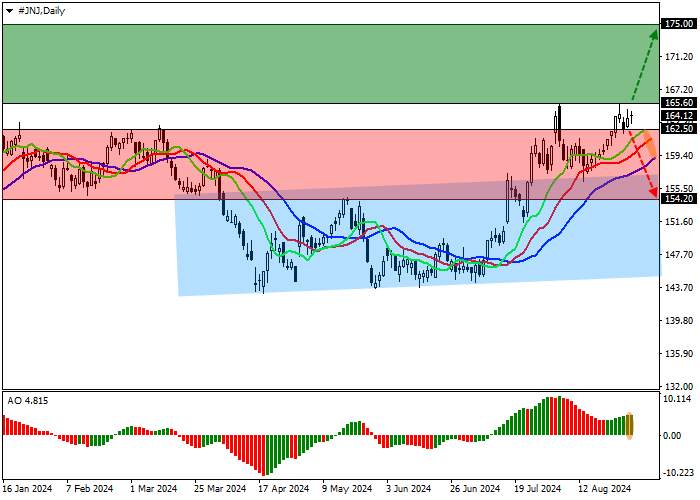
Trading tips
Long positions may be opened after the price grows and consolidates above 165.60, with the target at 175.00. Stop loss — 162.00. Implementation period: 7 days or more.
Short positions may be opened after the price declines and consolidates below 162.50, with the target at 154.20. Stop loss — 165.00.
风险提示:本文所述仅代表作者个人观点,不代表 Followme 的官方立场。Followme 不对内容的准确性、完整性或可靠性作出任何保证,对于基于该内容所采取的任何行为,不承担任何责任,除非另有书面明确说明。


暂无评论,立马抢沙发