| Scenario | |
|---|---|
| Timeframe | Weekly |
| Recommendation | BUY STOP |
| Entry Point | 57.85 |
| Take Profit | 59.38, 60.94, 62.50 |
| Stop Loss | 56.70 |
| Key Levels | 48.44, 50.00, 54.69, 57.81, 59.38, 60.94, 62.50 |
| Alternative scenario | |
|---|---|
| Recommendation | SELL STOP |
| Entry Point | 54.65 |
| Take Profit | 50.00, 48.44 |
| Stop Loss | 55.90 |
| Key Levels | 48.44, 50.00, 54.69, 57.81, 59.38, 60.94, 62.50 |
Current trend
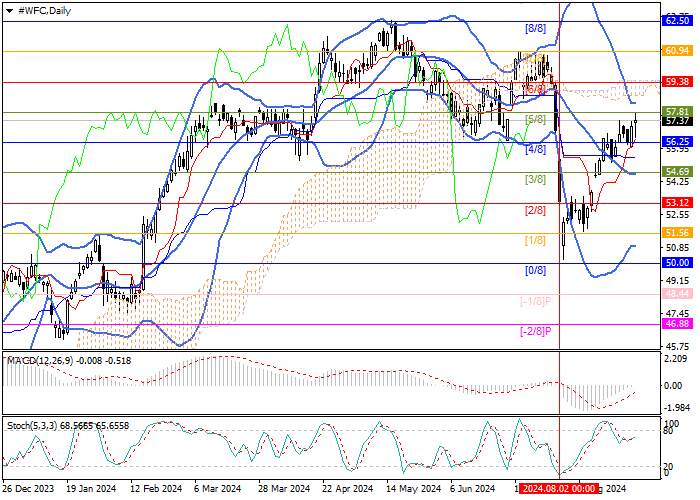
At the beginning of the month, Wells Fargo & Co. shares, one of the leading banking and insurance companies in the US, resumed growth after a correction within the long-term uptrend. During this time, the quotes reversed at the lower border of the main Murrey trading range of 50.00 (Murrey level [0/8]), moved into its positive part, and are approaching 57.81 (Murrey level [5/8]). After consolidation above, it may reach the 59.38 (Murrey level [6/8]), 60.94 (Murrey level [7/8]), and 62.50 (Murrey level [8/8]) area. In case of a breakdown of 54.69 (Murrey level [3/8]), supported by the middle line of Bollinger bands, a decline to 50.00 (Murrey level [0/8]) or 48.44 (Murrey level [–1/8]) is likely.
Technical indicators do not give a single signal: Bollinger bands are directed downwards, Stochastic is reversing upwards, and the MACD histogram is preparing to move into the positive zone and form a buy signal.
Support and resistance
Resistance levels: 57.81, 59.38, 60.94, 62.50.
Support levels: 54.69, 50.00, 48.44.

Trading tips
Long positions may be opened above 57.81, with the targets at 59.38, 60.94, 62.50, and stop loss 56.70. Implementation period: 5–7 days.
Short positions may be opened below 54.69, with the targets at 50.00, 48.44, and stop loss 55.90.
风险提示:以上内容仅代表作者或嘉宾的观点,不代表 FOLLOWME 的任何观点及立场,且不代表 FOLLOWME 同意其说法或描述,也不构成任何投资建议。对于访问者根据 FOLLOWME 社区提供的信息所做出的一切行为,除非另有明确的书面承诺文件,否则本社区不承担任何形式的责任。
FOLLOWME 交易社区网址: www.followme.ceo


加载失败()