American conglomerate Alphabet Inc. shares are trading at 165.00.
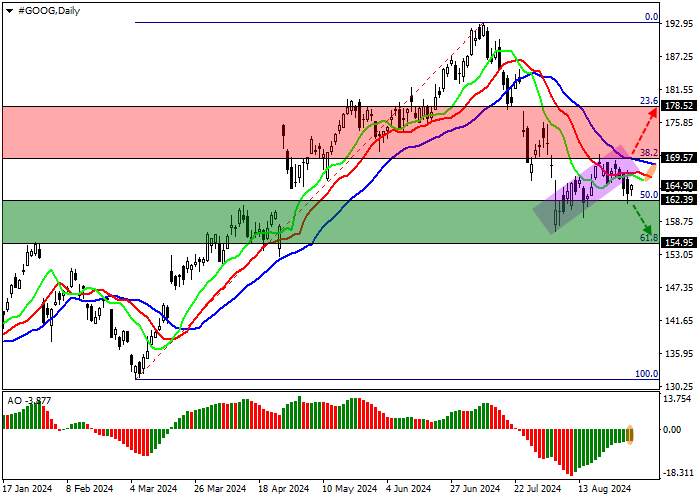
On the daily chart, a downtrend is forming, with the price reaching the 50% intermediate Fibonacci retracement level at 162.00.
On the four-hour chart, quotes have left the ascending channel of 170.00-165.00, which increases the probability of downward dynamics. After consolidation below the 50% Fibonacci intermediate retracement level of 162.00, the next target will be the full Fibonacci retracement level of 61.8% at 146.00.
Technical indicators are slowing down the sell signal: the fast EMA on the Alligator indicator is moving away from the signal line, and the AO histogram is forming correction bars below the crossover level.
Trading tips
Short positions can be opened after the price falls and consolidates below 162.00 with a target of 156.00. Stop loss — 164.00. Trading period: 7 days and above.
Long positions can be opened after the price increases and consolidates above 169.50 with a target of 178.50. Stop loss — below the channel resistance line of 167.00.


加载失败()