| Scenario | |
|---|---|
| Timeframe | Weekly |
| Recommendation | BUY STOP |
| Entry Point | 2500.00 |
| Take Profit | 2539.06, 2578.12 |
| Stop Loss | 2472.00 |
| Key Levels | 2382.81, 2421.88, 2500.00, 2539.06, 2578.12 |
| Alternative scenario | |
|---|---|
| Recommendation | BUY LIMIT |
| Entry Point | 2421.88 |
| Take Profit | 2539.06, 2578.12 |
| Stop Loss | 2393.00 |
| Key Levels | 2382.81, 2421.88, 2500.00, 2539.06, 2578.12 |
Current trend
The XAU/USD pair is trading within the medium-term uptrend, but has been correcting downwards for the last four sessions: the dollar is supported by the publication of positive data on US gross domestic product (GDP), which increased by 3.0% in the second quarter with preliminary estimates of 2.8%, while the consumer confidence index increased to 103.3 points in August confirming the confidence of households in the sustainability of the country's economic situation.
These statistics have raised fears that US Federal Reserve officials may take a cautious position and reduce the cost of borrowing in September by only 25 basis points or the number of adjustments from three to two this year. Nevertheless, the weakening of assets alternative to the dollar still looks moderate, as market participants expect the publication of August data on the American labor market on Friday. If they turn out to be weak, the probability of a recession in the United States will increase, and the instrument will be able to resume growth. Otherwise, the downtrend in prices will continue, as the regulator will lose an important reasoning for moving to aggressive monetary policy easing.
Long-term fundamental factors remain positive for gold: global geopolitical uncertainty persists, encouraging investment in precious metals as safe haven assets. In addition, with the start of the interest rate cut cycle from the US Federal Reserve, the dollar will again be under pressure, which may also support the growth of the XAU/USD pair.
Support and resistance
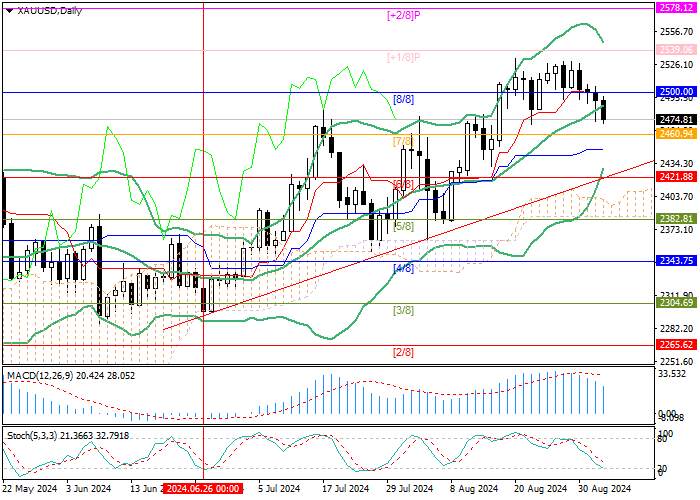
Technically, the price broke below the key level of 2500.00 (Murrey level [8/8]) and the central line of Bollinger Bands, which will allow quotes to continue the correction down to the level of 2421.88 (Murrey level [6/8], the lower line of Bollinger Bands). With a reverse breakout of the level of 2500.00, growth may resume towards the targets of 2539.06 (Murrey level [ 1/8]) and 2578.12 (Murrey level [ 2/8]).
Technical indicators confirm the continuation of the uptrend: Bollinger Bands are reversing up, MACD remains in the positive zone, while Stochastic is pointing down, but is approaching the oversold zone, which also does not exclude an early upward reversal.
Thus, the resumption of price growth in the near future seems to be the most likely scenario.
Resistance levels: 2500.00, 2539.06, 2578.12.
Support levels: 2421.88, 2382.81.

Trading tips
Long positions can be opened above the 2500.00 mark or after a price reversal around 2421.88 with targets of 2539.06, 2578.12 and stop-losses near 2472.00 and 2393.00, respectively. Implementation period: 5–7 days.
风险提示:以上内容仅代表作者或嘉宾的观点,不代表 FOLLOWME 的任何观点及立场,且不代表 FOLLOWME 同意其说法或描述,也不构成任何投资建议。对于访问者根据 FOLLOWME 社区提供的信息所做出的一切行为,除非另有明确的书面承诺文件,否则本社区不承担任何形式的责任。
FOLLOWME 交易社区网址: www.followme.ceo


加载失败()