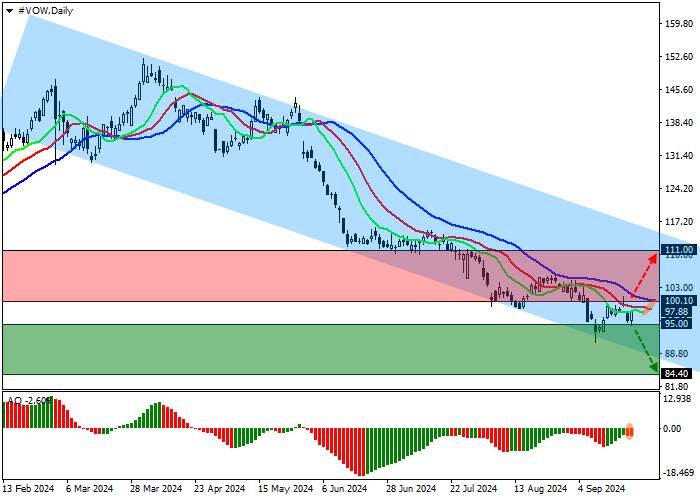
Shares of Volkswagen AG, a German automobile corporation, are trading within an intensifying correction slightly above 98.00.
On the daily chart, the price is falling within the downwards channel with dynamic boundaries of 114.00–87.00.
On the four-hour chart, despite the quotes being in the range, the potential for downward dynamics remains. Thus, the asset may reach the annual low of 93.60 soon. Then, there will be almost no obstacles on the path of further decline, except for the channel support line of 88.00.
Technical indicators are strengthening the sell signal: the fast EMA of the Alligator indicator is below the signal line, preparing to continue expanding the fluctuation range, and the AO histogram is forming downwards bars in the sell zone.
Trading tips
Short positions may be opened after the price declines and consolidates below 95.00, with the target at 84.40. Stop loss is 98.00. Implementation period: 7 days or more.
Long positions may be opened after the price grows and consolidates above 100.10, with the target at 111.00 and stop loss 97.00.


加载失败()