| Scenario | |
|---|---|
| Timeframe | Weekly |
| Recommendation | BUY STOP |
| Entry Point | 2680.0 |
| Take Profit | 2800.0 |
| Stop Loss | 2620.0 |
| Key Levels | 2510.0, 2625.0, 2680.0, 2800.0 |
| Alternative scenario | |
|---|---|
| Recommendation | SELL STOP |
| Entry Point | 2625.0 |
| Take Profit | 2510.0 |
| Stop Loss | 2660.0 |
| Key Levels | 2510.0, 2625.0, 2680.0, 2800.0 |
Current trend
The XAU/USD pair has returned to the 2650.00 mark, supported by fundamental factors.
Yesterday, the instrument set another record, exceeding the 2600.00 mark, which was the expected reaction of investors to the 50 basis point interest rate cut by the US Federal Reserve. During the steady slowdown in inflation, the precious metal price remained around 2500.00, expecting new drivers for movement, and the easing of monetary parameters now, when the indicator is still above the target of 2.0%, means the US regulator's recognition that a possible recession in the economy will have more negative consequences than price pressure. According to the head of the department, Jerome Powell, by the end of the year, the cost of borrowing may be adjusted by another 50 basis points, which will certainly act as a driver of the upward movement in the XAU/USD pair.
Meanwhile, according to the report of the US Commodity Futures Trading Commission (CFTC), the number of net speculative positions exceeded 300.0 thousand for the first time since 2020, having risen sharply from 282.5 thousand to 310.1 thousand. To assess where the capital inflow comes from, it is enough to look at similar data on positions in the S&P 500 index, the number of which fell to 122.9 thousand from 87.6 thousand over the same period: traders are redirecting funds from stocks to gold and other metals, supporting the growth of quotes. Almost a similar situation is observed on the Chicago Mercantile Exchange (CME Group): according to the report for the last week, the average daily trading volume of gold contracts is almost 400.0 thousand, and the option position increased to 176.7 thousand, which is a record for September.
Support and resistance
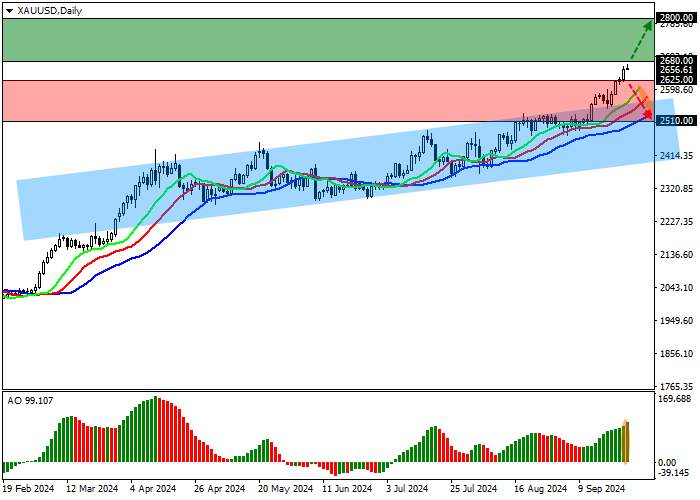
On the D1 chart, the instrument is held significantly above the resistance line of the long-term ascending channel with boundaries of 2600.0–2400.0.
Technical indicators remain in a state of a stable buy signal, which continues to strengthen: fast EMAs on the Alligator indicator are moving away from the signal line, and the AO histogram is forming new correction bars, being above the transition level.
Support levels: 2625.0, 2510.0.
Resistance levels: 2680.0, 2800.0.

Trading tips
If the asset continues to grow and the price consolidates above the resistance level of 2680.0, buy positions with a target of 2800.0 will be relevant. Stop loss — 2620.0. Implementation period: 7 days or more.
If the asset continues to decline and the price consolidates below the support level of 2625.0, sell positions with a target of 2510.0 can be opened. Stop loss — 2660.0.
风险提示:本文所述仅代表作者个人观点,不代表 Followme 的官方立场。Followme 不对内容的准确性、完整性或可靠性作出任何保证,对于基于该内容所采取的任何行为,不承担任何责任,除非另有书面明确说明。


加载失败()