
| Scenario | |
|---|---|
| Timeframe | Weekly |
| Recommendation | BUY STOP |
| Entry Point | 29.60 |
| Take Profit | 31.30 |
| Stop Loss | 29.20 |
| Key Levels | 26.50, 28.00, 28.30, 29.00, 29.20, 29.60, 30.00, 31.50, 31.70 |
| Alternative scenario | |
|---|---|
| Recommendation | SELL STOP |
| Entry Point | 28.30 |
| Take Profit | 26.50 |
| Stop Loss | 29.00 |
| Key Levels | 26.50, 28.00, 28.30, 29.00, 29.20, 29.60, 30.00, 31.50, 31.70 |
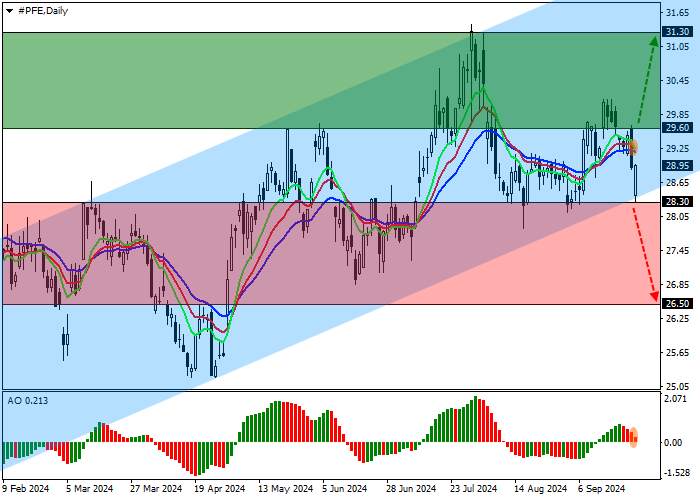
Shares of Pfizer Inc., the largest American pharmaceutical company, are correcting at 29.00.
On the daily chart, the price is above the support line of the ascending channel with dynamic boundaries of 31.70–28.00, moving away from it.
On the four-hour chart, the quotes could not leave the range and reversed at the support level of 28.00. After consolidating above 30.00, the asset may reach the annual high of 31.50. However, in the event of a return to the 28.00 area, negative dynamics may develop.
Technical indicators do not provide a stable signal: fast EMAs on the Alligator indicator are above the signal line, and the AO histogram forms correction bars above the transition level.
Trading tips
Long positions may be opened after the price rises and consolidates above 29.60, with the target at 31.30. Stop loss is 29.20. Implementation period: 7 days or more.
Short positions may be opened after the price falls and consolidates below 28.30, with the target at 26.50. Stop loss is 29.00.
风险提示:本文所述仅代表作者个人观点,不代表 Followme 的官方立场。Followme 不对内容的准确性、完整性或可靠性作出任何保证,对于基于该内容所采取的任何行为,不承担任何责任,除非另有书面明确说明。


暂无评论,立马抢沙发