| Scenario | |
|---|---|
| Timeframe | Weekly |
| Recommendation | BUY STOP |
| Entry Point | 2830.00 |
| Take Profit | 3125.00, 3437.50 |
| Stop Loss | 2590.00 |
| Key Levels | 1875.00, 2120.00, 2500.00, 2812.50, 3125.00, 3437.50 |
| Alternative scenario | |
|---|---|
| Recommendation | SELL STOP |
| Entry Point | 2475.00 |
| Take Profit | 2120.00, 1875.00 |
| Stop Loss | 2660.00 |
| Key Levels | 1875.00, 2120.00, 2500.00, 2812.50, 3125.00, 3437.50 |
Current trend
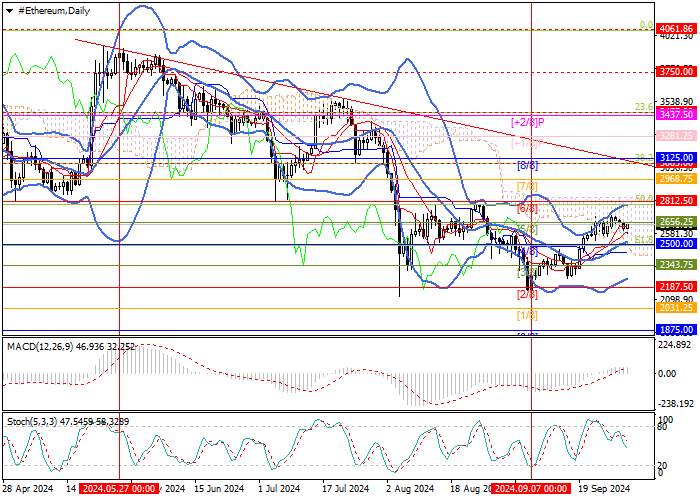
The ETH/USD pair resumed its rally four weeks ago, attempting to reverse the long-term downtrend and is currently testing the resistance zone of 2656.25–2812.50 (Murrey [5/8]–Murrey [6/8], 50.0% Fibonacci retracement). Its breakout would allow the upward movement to continue towards the targets of 3125.00 (Murrey [8/8], 38.2% Fibonacci retracement) and 3437.50 (Murrey [ 2/8], 23.6% Fibonacci retracement). After breaking through the 2500.00 mark (Murrey level [4/8], 61.8% Fibonacci correction), supported by the central line of Bollinger Bands, which seems key for the “bears”, the price decline could resume to 2187.50 (Murrey level [2/8]), 1875.00 (Murrey level [0/8]).
Technical indicators confirm the likelihood of the continuation of the current trend: Bollinger Bands are directed up and Stochastic is pointing down, while MACD is increasing in the positive zone.
Support and resistance
Resistance levels: 2812.50, 3125.00, 3437.50.
Support levels: 2500.00, 2120.00, 1875.00.

Trading tips
Long positions can be opened above the 2812.50 mark with targets at 3125.00, 3437.50 and a stop-loss at 2590.00. Implementation period: 5–7 days.
Short positions can be opened below 2500.00 with targets at 2120.00, 1875.00 and a stop-loss at 2660.00.
风险提示:以上内容仅代表作者或嘉宾的观点,不代表 FOLLOWME 的任何观点及立场,且不代表 FOLLOWME 同意其说法或描述,也不构成任何投资建议。对于访问者根据 FOLLOWME 社区提供的信息所做出的一切行为,除非另有明确的书面承诺文件,否则本社区不承担任何形式的责任。
FOLLOWME 交易社区网址: www.followme.ceo


加载失败()