| Scenario | |
|---|---|
| Timeframe | Weekly |
| Recommendation | BUY STOP |
| Entry Point | 63800.00 |
| Take Profit | 56250.00, 53125.00 |
| Stop Loss | 62600.00 |
| Key Levels | 53125.00, 56250.00, 59375.00, 65625.00, 68750.00 |
| Alternative scenario | |
|---|---|
| Recommendation | SELL STOP |
| Entry Point | 59300.00 |
| Take Profit | 56250.00, 53125.00 |
| Stop Loss | 61500.00 |
| Key Levels | 53125.00, 56250.00, 59375.00, 65625.00, 68750.00 |
Current trend
Last week, the BTC/USD pair adjusted downwards, falling below the 60000.00 mark, but since Friday, the instrument has been actively restoring lost positions.
The uptrend in quotes was primarily facilitated by the publication of September data on the US labor market, which turned out to be positive. So, employment immediately sharply by 254.0 thousand instead of the expected 147.0 thousand, while the unemployment rate decreased from 4.2% to 4.1%, confirming the likelihood of a slower easing of monetary policy by the US Federal Reserve, but at the same time reflecting the recovery of the national economy and a serious reduction in the risks of recession, which, in turn, contributes to an increase in investor demand for risky assets, including digital ones. Additional support for the trading instrument was provided by the lack of reaction of the Israeli authorities to the attack from Iran: experts feared retaliatory missile strikes on the oil or nuclear infrastructure, and are confident that the escalation of the Middle East conflict is currently being hindered by the current American administration, which does not benefit from the increase in oil prices before the presidential elections. All these factors caused an increase in investments in spot Bitcoin ETFs: on Friday, their volume was recorded in the region around 25.6 million dollars, although last week the total amount of funds withdrawn from the ETFs amounted to 274.3 million dollars.
Thus, the fundamental background becomes more favorable for the cryptocurrency market, strengthening the prospects for its further recovery.
Support and resistance
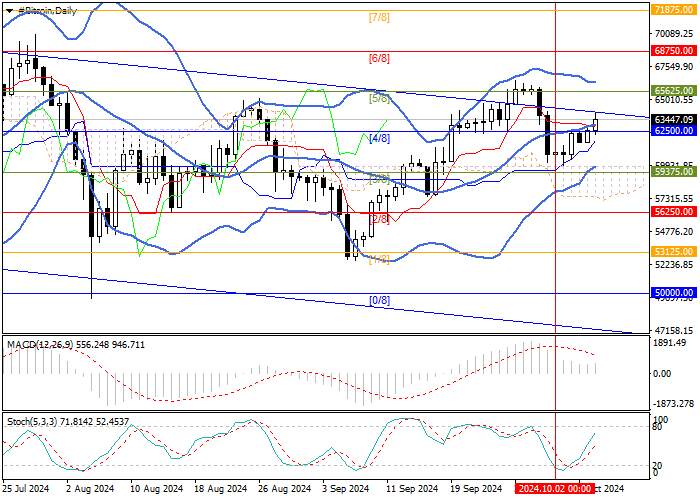
Technically, the asset has risen above the central line of Bollinger Bands, which will allow quotes to strengthen the upward dynamics towards the targets of 65625.00 (Murrey level [5/8]) and 68750.00 (Murrey level [6/8]). The key mark for the "bears" is 59375.00 (Murrey level [3/8]), consolidation below which will cause a decline to 56250.00 (Murrey level [2/8]) and 53125.00 (Murrey level [1/8]), but such a scenario is still seen as less likely.
Technical indicators confirm further growth: Bollinger Bands and Stochastic are directed upwards, and MACD is stable in the positive zone.
Resistance levels: 65625.00, 68750.00.
Support levels: 59375.00, 56250.00, 53125.00.

Trading tips
Long positions can be opened from the 63800.00 mark with targets of 56250.00, 53125.00 and a stop-loss around 62600.00. Implementation period: 5–7 days.
Short positions can be opened below the level of 59375.00 with targets of 56250.00, 53125.00 and a stop-loss around 61500.00.
风险提示:本文所述仅代表作者个人观点,不代表 Followme 的官方立场。Followme 不对内容的准确性、完整性或可靠性作出任何保证,对于基于该内容所采取的任何行为,不承担任何责任,除非另有书面明确说明。


加载失败()