| Scenario | |
|---|---|
| Timeframe | Weekly |
| Recommendation | BUY STOP |
| Entry Point | 625.05 |
| Take Profit | 687.50, 750.00 |
| Stop Loss | 575.00 |
| Key Levels | 468.75, 500.00, 562.50, 625.00, 687.50, 750.00 |
| Alternative scenario | |
|---|---|
| Recommendation | SELL STOP |
| Entry Point | 562.45 |
| Take Profit | 500.00, 468.75 |
| Stop Loss | 600.00 |
| Key Levels | 468.75, 500.00, 562.50, 625.00, 687.50, 750.00 |
Current trend
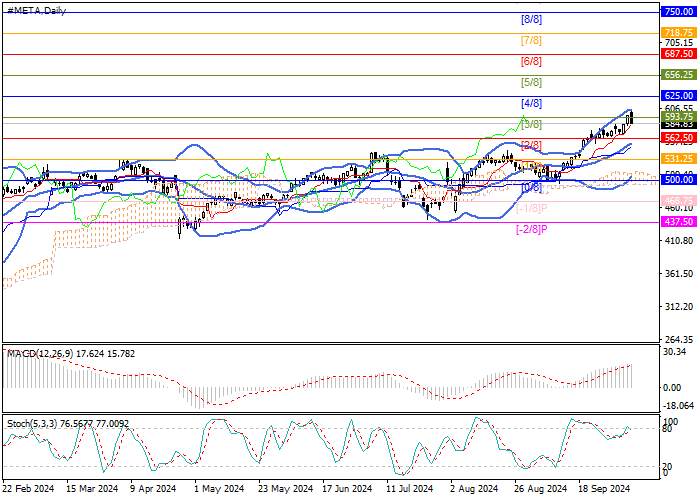
Shares of Meta Platforms Inc., an American transnational holding company that owns a technology conglomerate and the largest social network Facebook, are moving within a long-term uptrend, testing the resistance zone of 593.75–625.00 (Murrey level [3/8]–[4/8]). After its breakout, the quotes will move to the positive part of the Murrey trading range and reach the targets of 687.50 (Murrey level [6/8]) and 750.00 (Murrey level [8/8]). In case of a reverse breakdown of the middle line of Bollinger Bands 562.50 (Murrey level [2/8]), the correction will resume to the lower border of the Murrey trading range 500.00 (Murrey level [0/8]) and further to the lower reversal zone to the 468.75 mark (Murrey level [–1/8]).
Technical indicators confirm the continuation of the upward trend: Bollinger Bands and Stochastic are directed upward, although the latter is entering the overbought zone, and the MACD histogram is increasing in the positive zone.
Support and resistance
Resistance levels: 625.00, 687.50, 750.00.
Support levels: 562.50, 500.00, 468.75.

Trading tips
Long positions may be opened above 625.00, with the targets at 687.50, 750.00 and stop loss 575.00. Implementation period: 5–7 days.
Short positions may be opened below 562.50, with the targets at 500.00, 468.75 and stop loss 600.00.
风险提示:以上内容仅代表作者或嘉宾的观点,不代表 FOLLOWME 的任何观点及立场,且不代表 FOLLOWME 同意其说法或描述,也不构成任何投资建议。对于访问者根据 FOLLOWME 社区提供的信息所做出的一切行为,除非另有明确的书面承诺文件,否则本社区不承担任何形式的责任。
FOLLOWME 交易社区网址: www.followme.ceo


加载失败()