Shares of ExxonMobil Corp., an American oil company, are trading in a correction trend at 122.00.
On the daily chart, the price has left the sideways channel 120.00–108.00 and is holding above the resistance line.
On the four-hour chart, the upward movement received a significant impetus after breaking through the channel resistance line 120.00. A consolidation above will allow the quotes to reach the year’s high of 124.00 and 131.00. In case of a breakout of 119.00 and the return to the channel, further decline is possible.
Technical indicators maintain a buy signal: fast EMAs on the Alligator indicator are far from the signal line, and the AO histogram forms ascending bars above the transition level.
Trading tips
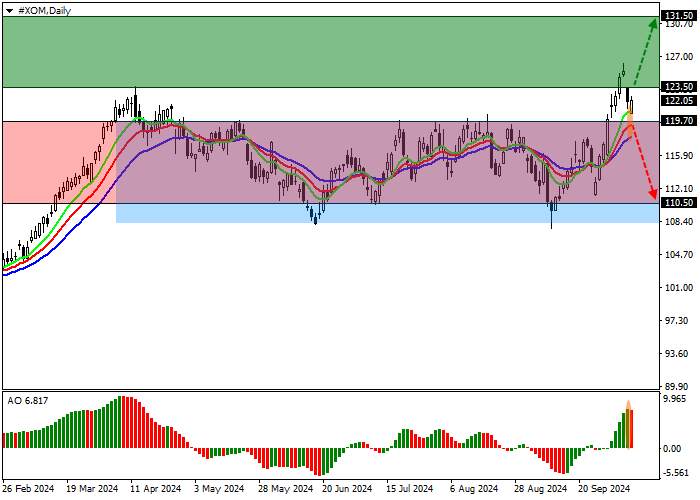
Long positions may be opened after the price rises and consolidates above 123.50, with the target at 131.50. Stop loss — 120.00. Implementation period: 7 days or more.
Short positions may be opened after the price falls and consolidates below 119.70, with the target at 110.50. Stop loss — 122.00.


加载失败()