Shares of Verizon Communications Inc., one of the largest American telecommunications companies, are trading at 44.00.
On the daily chart, the price is moving in a corrective trend, holding above the resistance line of the sideways channel 43.00–38.50.
On the four-hour chart, the nearest resistance level is the year’s high of 45.00. A consolidation above will allow the quotes to reach 47.00. However, if the asset consolidates below 43.00, negative dynamics are likely to develop.
Technical indicators maintain a buy signal: fast EMAs on the Alligator indicator are above the signal line, expanding fluctuation range, and the AO histogram forms correction bars above the transition level.
Trading tips
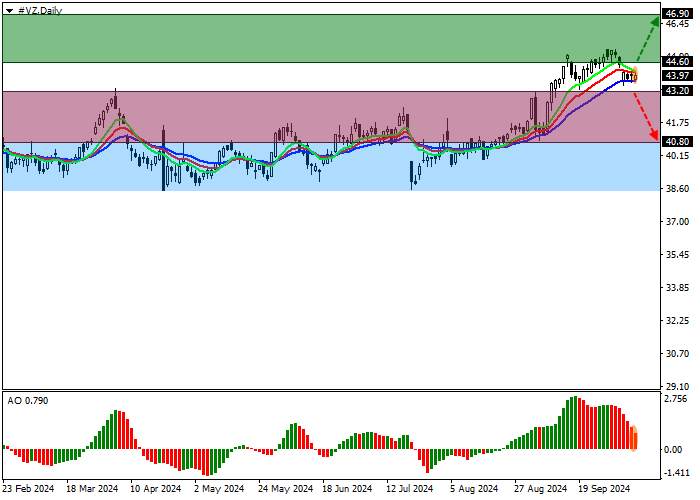
Long positions may be opened after the price rises and consolidates above 44.60, with the target at 46.90. Stop loss — 43.90. Implementation period: 7 days or more.
Short positions may be opened after the price declines and consolidates below 43.20, with the target at 40.80. Stop loss — 44.00.


加载失败()