| Scenario | |
|---|---|
| Timeframe | Intraday |
| Recommendation | SELL STOP |
| Entry Point | 69.95 |
| Take Profit | 68.15 |
| Stop Loss | 71.00 |
| Key Levels | 67.00, 68.15, 69.06, 70.00, 71.00, 71.60, 72.17, 73.00 |
| Alternative scenario | |
|---|---|
| Recommendation | BUY STOP |
| Entry Point | 71.05 |
| Take Profit | 73.00 |
| Stop Loss | 70.00 |
| Key Levels | 67.00, 68.15, 69.06, 70.00, 71.00, 71.60, 72.17, 73.00 |
Current trend
During the Asian session, WTI Crude Oil prices are developing the “bearish” momentum formed at the end of last week, testing the level of 70.60 and renewing the lows of October 2 against poor macroeconomic statistics from China.
Thus, the September exports decreased from 8.7% to 2.4%, worse than the forecast of 6.0%, and imports – from 0.5% to 0.3% compared to 0.9%. The trade balance surplus fell from 91.02B dollars to 81.71B dollars, although experts expected 89.8B dollars. In addition, the consumer price index slowed from 0.6% to 0.4% YoY and from 0.4% to 0.0% MoM against neutral estimates, and the production inflation indicator fell from –1.8% to –2.8%, while analysts expected –2.5%, reflecting growing problems in the Chinese economy. The Chinese authorities are taking stimulating measures but so far, they have achieved only limited success. In January-September, oil imports fell by 2.8% to an absolute value of 412.39M tons, while the country spent 0.2% more on these purchases compared to the same period a year earlier, and the value was 45.48B tons, MoM.
In turn, the asset is supported by the ongoing geopolitical tensions in the Middle East. Analysts fear a possible Israeli attack on Iranian oil infrastructure facilities, which will significantly reduce oil supply. In response, Iran may block the Strait of Hormuz, a key oil transportation route.
Support and resistance
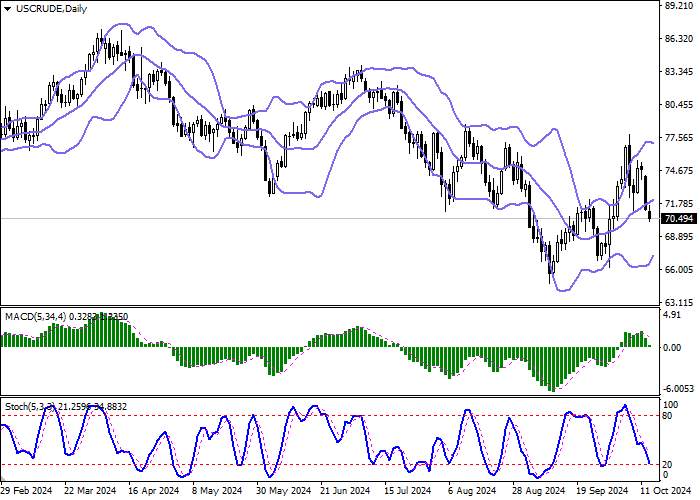
On the daily chart, Bollinger bands are growing steadily. The price range is narrowing, reflecting the ambiguous nature of trading in the short term. The MACD indicator is declining, keeping a sell signal (the histogram is below the signal line), and is trying to consolidate below the zero mark. Stochastic is near the lows, indicating that the asset may become oversold in the ultra-short term.
Resistance levels: 71.00, 71.60, 72.17, 73.00.
Support levels: 70.00, 69.06, 68.15, 67.00.


Trading tips
Short positions may be opened after a breakdown of 70.00, with the target at 68.15. Stop loss — 71.00. Implementation period: 2–3 days.
Long positions may be opened after a rebound from the 70.00 level and a breakout of the 71.00 level, with the target at 73.00. Stop loss — 70.00.
风险提示:本文所述仅代表作者个人观点,不代表 Followme 的官方立场。Followme 不对内容的准确性、完整性或可靠性作出任何保证,对于基于该内容所采取的任何行为,不承担任何责任,除非另有书面明确说明。
FOLLOWME 交易社区网址: www.followme.ceo


加载失败()