| Scenario | |
|---|---|
| Timeframe | Intraday |
| Recommendation | BUY STOP |
| Entry Point | 1.3805 |
| Take Profit | 1.3900 |
| Stop Loss | 1.3750 |
| Key Levels | 1.3675, 1.3700, 1.3730, 1.3765, 1.3800, 1.3838, 1.3864, 1.3900 |
| Alternative scenario | |
|---|---|
| Recommendation | SELL STOP |
| Entry Point | 1.3760 |
| Take Profit | 1.3700 |
| Stop Loss | 1.3800 |
| Key Levels | 1.3675, 1.3700, 1.3730, 1.3765, 1.3800, 1.3838, 1.3864, 1.3900 |
Current trend
The USD/CAD pair is showing mixed dynamics, consolidating near 1.3800 and local highs from October 15: market activity at the end of the week remains quite low due to the small number of macroeconomic publications. Investors continue to evaluate the data presented earlier and are preparing for the upcoming US presidential elections in early November.
Yesterday, the US market received data on Retail Sales: in September, the indicator increased by 0.4% after increasing by 0.1% in the previous month, while analysts expected 0.3%. Meanwhile, Industrial Production lost 0.3% after growing by 0.3% in the previous month, while analysts expected –0.2%. In addition, the Philadelphia Fed Manufacturing Survey rose from 1.7 points to 10.3 points in October, the Initial Jobless Claims for the week ended October 11 sharply decreased from 260.0 thousand to 241.0 thousand, and the Continuing Jobless Claims for the week ended October 4 increased from 1.858 million to 1.867 million, but turned out to be lower than the expected 1.870 million.
On Tuesday, Canada released inflation data that could influence future monetary policy decisions: the Bank of Canada's Consumer Price Index Core in September showed zero monthly dynamics after –0.1% in the previous month, and in annual terms it adjusted from 1.5% to 1.6%, while the Consumer Price Index fell from –0.2% to –0.4% and from 2.0% to 1.6%, against preliminary estimates of 1.8%, respectively.
Support and resistance
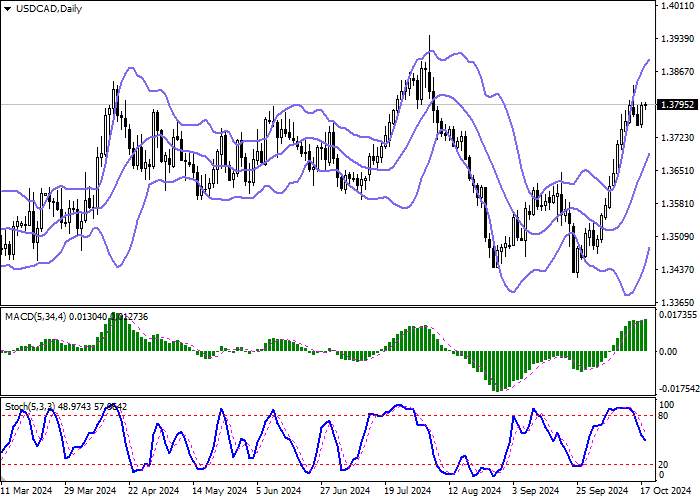
Bollinger Bands on the daily chart demonstrate confident growth: the price range narrows slightly from below, but remains quite spacious for the current level of activity on the market. MACD is growing, maintaining a weak buy signal (the histogram is located above the signal line). Stochastic, on the contrary, maintains a confident downward direction, practically not reacting to the appearance of corrective growth at the end of the week.
Resistance levels: 1.3800, 1.3838, 1.3864, 1.3900.
Support levels: 1.3765, 1.3730, 1.3700, 1.3675.


Trading tips
Long positions can be opened after a confident breakout of 1.3800 with a target of 1.3900. Stop-loss — 1.3750. Implementation time: 2-3 days.
A rebound from 1.3800 as resistance followed by a breakdown of 1.3765 may be a signal to open new short positions with a target of 1.3700. Stop-loss — 1.3800.
风险提示:以上内容仅代表作者或嘉宾的观点,不代表 FOLLOWME 的任何观点及立场,且不代表 FOLLOWME 同意其说法或描述,也不构成任何投资建议。对于访问者根据 FOLLOWME 社区提供的信息所做出的一切行为,除非另有明确的书面承诺文件,否则本社区不承担任何形式的责任。
FOLLOWME 交易社区网址: www.followme.ceo


加载失败()