| Scenario | |
|---|---|
| Timeframe | Intraday |
| Recommendation | SELL STOP |
| Entry Point | 0.8640 |
| Take Profit | 0.8570 |
| Stop Loss | 0.8675 |
| Key Levels | 0.8541, 0.8570, 0.8600, 0.8641, 0.8669, 0.8700, 0.8730, 0.8776 |
| Alternative scenario | |
|---|---|
| Recommendation | BUY STOP |
| Entry Point | 0.8665 |
| Take Profit | 0.8730 |
| Stop Loss | 0.8641 |
| Key Levels | 0.8541, 0.8570, 0.8600, 0.8641, 0.8669, 0.8700, 0.8730, 0.8776 |
Current trend
During the morning session, the USD/CHF pair consolidated at 0.8648 due to reduced market activity in anticipation of new drivers for movement.
On Tuesday at 16:00 (GMT 2), the Richmond Federal Reserve Bank (FRB) October manufacturing business activity index is due, and a speech by Patrick Harker, a member of the Federal Open Market Committee, will take place. The official may advocate for a further reduction in the interest rate, which will not have a significant impact on the quotes since, according to the Chicago Mercantile Exchange (CME) FedWatch Instrument, the probability of a –25 basis point adjustment in borrowing costs at the regulator’s November meeting exceeds 85.0%. The upcoming US presidential election is creating much greater uncertainty in the market. If Republican candidate Donald Trump wins, analysts expect more “hawkish” monetary rhetoric and a tariff grid tightening, intensifying the so-called tariff wars.
Last week, the dollar was supported by the retail sales dynamics. The September indicator accelerated from 0.1% to 0.4%, above analysts’ forecasts of 0.3%, and excluding car sales – from 0.2% to 0.5% relative to estimates of 0.1%. In addition, in October, the Philadelphia Federal Reserve Bank’s manufacturing PMI increased from 1.7 points to 10.3 points, exceeding expectations of 3.0 points. Meanwhile, the September industrial production fell by 0.3% after growing by 0.3%, although experts expected a slowdown of 0.2%.
In Switzerland, the September export volumes increased from 20.65B francs to 22.53B francs, while imports increased from 15.90B francs to 17.58B francs, resulting in a trade surplus correction from 4.74B francs to 4.95B francs.
Support and resistance
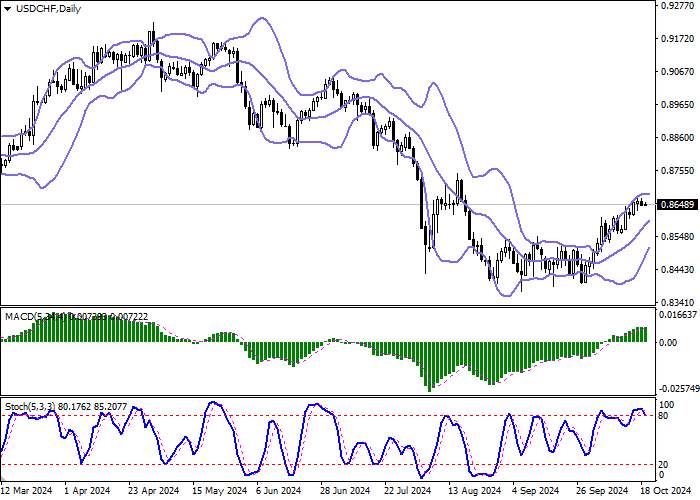
On the daily chart, Bollinger bands are growing moderately: the price range is narrowing, reflecting the ambiguous nature of trading. The MACD indicator is rising, maintaining a poor buy signal (the histogram is above the signal line). Stochastic retreated from its highs and is trying to reverse downwards, signaling further development of the “bearish” corrective impulse in the ultra-short term.
Resistance levels: 0.8669, 0.8700, 0.8730, 0.8776.
Support levels: 0.8641, 0.8600, 0.8570, 0.8541.


Trading tips
Short positions may be opened after a breakdown of 0.8641, with the target at 0.8570. Stop loss — 0.8675. Implementation period: 1–2 days.
Long positions may be opened after a rebound from the 0.8641 level and a breakout of 0.8669, with the target at 0.8730. Stop loss — 0.8641.
风险提示:本文所述仅代表作者个人观点,不代表 Followme 的官方立场。Followme 不对内容的准确性、完整性或可靠性作出任何保证,对于基于该内容所采取的任何行为,不承担任何责任,除非另有书面明确说明。


加载失败()