| Scenario | |
|---|---|
| Timeframe | Weekly |
| Recommendation | BUY STOP |
| Entry Point | 0.8710 |
| Take Profit | 0.8795, 0.8890, 0.9035 |
| Stop Loss | 0.8650 |
| Key Levels | 0.8400, 0.8590, 0.8705, 0.8795, 0.8890, 0.9035 |
| Alternative scenario | |
|---|---|
| Recommendation | SELL STOP |
| Entry Point | 0.8585 |
| Take Profit | 0.8400 |
| Stop Loss | 0.8690 |
| Key Levels | 0.8400, 0.8590, 0.8705, 0.8795, 0.8890, 0.9035 |
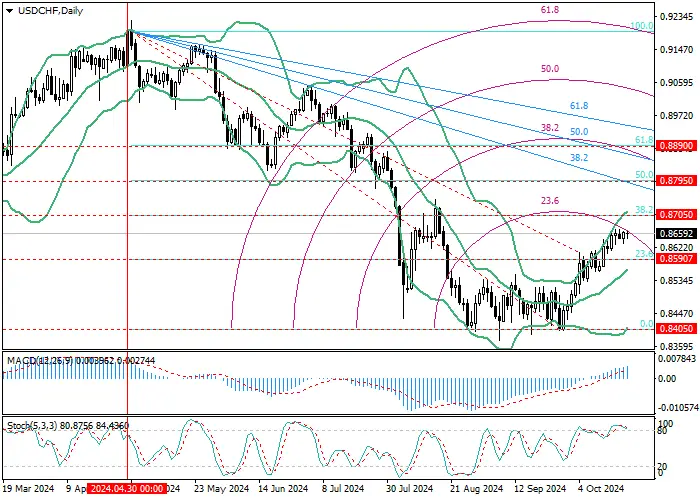
USD/CHF, D1
On the D1 chart, the USD/CHF pair began a corrective growth from the level of 0.8405 (0.0% retracement). Currently, quotes are close to the 0.8705 mark (38.2% retracement), a breakout of which will provide an opportunity for the upward dynamics to intensify the to the targets of 0.8795 (50.0% retracement) and 0.8890 (61.8% retracement), but in this case, the trading instrument will have to break through the counter downward fan. With the reverse consolidation of quotes below the 0.8590 mark (23.6% retracement), supported by the central line of Bollinger Bands, the price may return to the level of 0.8405. Technical indicators do not give a clear signal: Bollinger Bands are turning up, MACD is increasing in the positive zone, but Stochastic is preparing to leave the overbought zone, which does not exclude the resumption of the decline.

USD/CHF, W1
On the W1 chart, the price has reversed from 0.8400 (0.0% retracement) and is trying to reach 0.8795 (23.6% retracement) but is currently being held back by the central line of Bollinger Bands. If the 0.8795 mark is broken out, the next growth target will be 0.9035 (38.2% retracement), otherwise the pair will resume its decline to the 0.8400 area. Technical indicators do not give a clear signal: Bollinger Bands are pointing downwards, but Stochastic has reversed upwards, and MACD is decreasing in the negative zone.

Support and resistance
Continued growth seems more likely in the near future. If the level of 0.8705 is broken out (38.2% retracement, D1; central line of Bollinger Bands, W1), the upward dynamics may intensify to the targets of 0.8795 (50.0% retracement, D1; 23.6% retracement, W1), 0.8890 (61.8% retracement, D1) and 0.9035 (38.2% retracement, W1). If the level of 0.8590 is broken downwards (23.6% retracement, central line of Bollinger Bands, D1), the decline may resume to the mark of 0.8400 (0.0% retracement, D1 and W1).
Resistance levels: 0.8705, 0.8795, 0.8890, 0.9035.
Support levels: 0.8590, 0.8400.
Trading tips
Long positions can be opened above the 0.8705 mark with targets at 0.8795, 0.8890, 0.9035 and a stop-loss at 0.8650. Implementation period: 5–7 days.
Short positions can be opened below 0.8590 with a target at 0.8400 and a stop-loss at 0.8690.
风险提示:以上内容仅代表作者或嘉宾的观点,不代表 FOLLOWME 的任何观点及立场,且不代表 FOLLOWME 同意其说法或描述,也不构成任何投资建议。对于访问者根据 FOLLOWME 社区提供的信息所做出的一切行为,除非另有明确的书面承诺文件,否则本社区不承担任何形式的责任。
FOLLOWME 交易社区网址: www.followme.ceo

