| Scenario | |
|---|---|
| Timeframe | Weekly |
| Recommendation | BUY STOP |
| Entry Point | 168.80 |
| Take Profit | 181.25, 187.50 |
| Stop Loss | 160.00 |
| Key Levels | 131.25, 137.50, 150.00, 168.75, 181.25, 187.50 |
| Alternative scenario | |
|---|---|
| Recommendation | SELL STOP |
| Entry Point | 149.95 |
| Take Profit | 137.50, 131.25 |
| Stop Loss | 159.00 |
| Key Levels | 131.25, 137.50, 150.00, 168.75, 181.25, 187.50 |
Current trend
Unlike most digital assets, the SOL/USD pair started the week with growth and reached three-month highs around 171.47, but today it also moved to a corrective decline.
Currently, the pressure on the trading instrument is exerted by the sale of coins on the platform Pump.fun, specializing in the placement of meme tokens on the Solana blockchain. Experts note that the Pump.fun Fee account decreased by 40.0 thousand SOL coins totaling 6.68 million dollars, which led to sales by smaller token holders.
Nevertheless, the potential for the resumption of upward dynamics is seen to be very significant, since the general fundamental background is favorable for this. Thus, the Solana network continues to attract more and more new users due to the consistently low transaction fee, which, according to Solscan, averages 0.015 dollars against 0.5286 dollars from a direct competitor – on the Ethereum network. Investors also expect that in the near future the US Securities and Exchange Commission (SEC) may approve the launch of Solana-ETF, which will attract additional liquidity to the market. In August, such a tool was approved by Brazilian supervisory authorities, which set a precedent for other jurisdictions. In addition, the resumption of growth of the entire cryptocurrency market is facilitated by an increase in the chances of a return to the White House of US presidential candidate Donald Trump, whose position in relation to digital assets is very loyal.
Support and resistance
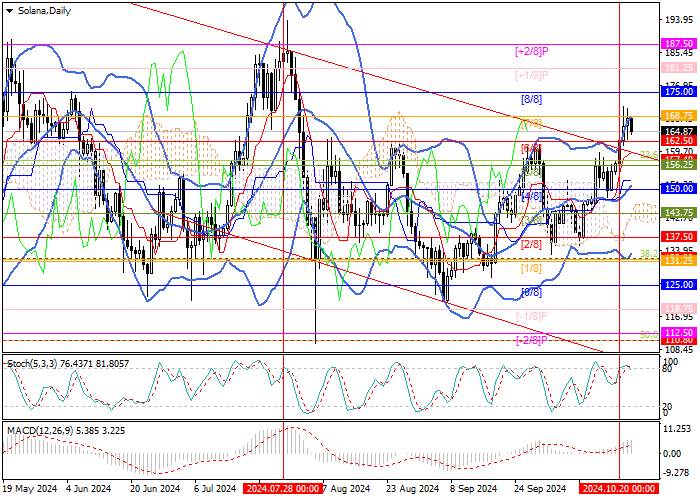
Technically, the price has left the medium-term descending channel and has probably completed the formation of the "inverted head and shoulders" figure, which, with a repeated breakout of the 168.75 mark (Murrey level [7/8]), will allow quotes to continue growing towards the targets of 181.25 (Murrey level [ 1/8]) and 187.50 (Murrey level [ 2/8]). The key for the "bears" is the level of 150.00 (Murrey level [4/8]), supported by the central line of Bollinger Bands, consolidation below which will lead to the resumption of downward dynamics to the levels of 137.50 (Murrey level [2/8]) and 131.25 (Murrey level [1/8], 38.2% Fibonacci retracement).
Technical indicators allow for continued growth: Bollinger Bands are reversing up, and MACD increases in the positive zone, confirming the continuation of the formation of a new uptrend, while Stochastic reverses down near the overbought zone, which does not exclude a decline, but its potential is seen to be limited.
Resistance levels: 168.75, 181.25, 187.50.
Support levels: 150.00, 137.50, 131.25.

Trading tips
Long positions can be opened above the 168.75 mark with targets of 181.25, 187.50 and a stop-loss around 160.00. Implementation period: 5–7 days.
Short positions can be opened below the 150.00 mark with targets of 137.50, 131.25 and a stop-loss around 159.00.
风险提示:本文所述仅代表作者个人观点,不代表 Followme 的官方立场。Followme 不对内容的准确性、完整性或可靠性作出任何保证,对于基于该内容所采取的任何行为,不承担任何责任,除非另有书面明确说明。


加载失败()