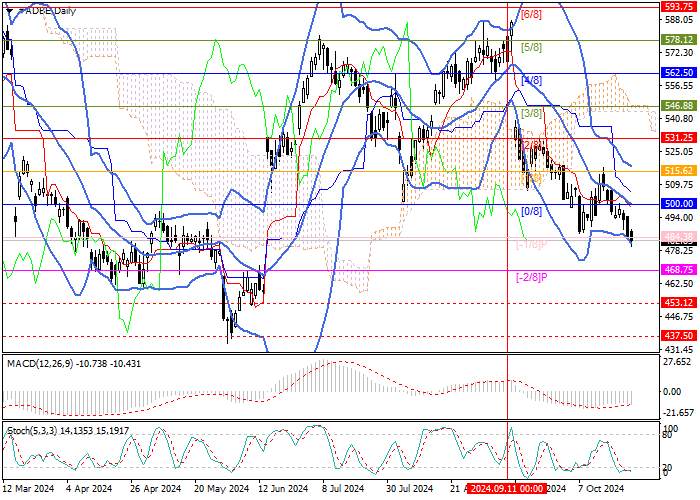
| Scenario | |
|---|---|
| Timeframe | Weekly |
| Recommendation | SELL |
| Entry Point | 482.76 |
| Take Profit | 468.75, 453.12, 437.50 |
| Stop Loss | 494.00 |
| Key Levels | 437.50, 453.12, 468.75, 484.38, 515.62, 546.88, 562.50 |
| Alternative scenario | |
|---|---|
| Recommendation | BUY STOP |
| Entry Point | 515.65 |
| Take Profit | 546.88, 562.50 |
| Stop Loss | 503.00 |
| Key Levels | 437.50, 453.12, 468.75, 484.38, 515.62, 546.88, 562.50 |
Current trend
Shares of Adobe Inc., a leading American software developer, have been falling for the second month. During this time, the price rebounded from the 578.12 mark (Murrey level [5/8]), entered the lower reversal zone of the Murrey trading range, and is currently testing the 484.38 area (Murrey level [–1/8]). Consolidation below will allow the negative dynamics to reach 468.75 (Murrey level [–2/8]), 453.12 (Murrey level [–2/8], H1), and 437.50 (Murrey level [2/8], W1). After a breakout of the upper line of Bollinger Bands 515.62 (Murrey level [1/8]), growth to the zone of 546.88 (Murrey level [3/8]) and 562.50 (Murrey level [4/8]) may follow.
Technical indicators reflect the formation of a downward trend: Bollinger Bands are directed downwards, the MACD histogram is stable in the negative zone, and Stochastic is horizontal in the oversold zone.
Support and resistance
Resistance levels: 515.62, 546.88, 562.50.
Support levels: 484.38, 468.75, 453.12, 437.50.

Trading tips
Short positions may be opened below 484.38, with the targets at 468.75, 453.12, 437.50, and stop loss 494.00. Implementation period: 5–7 days.
Long positions may be opened above 515.62, with the targets at 546.88, 562.50, and stop loss 503.00.
风险提示:以上内容仅代表作者或嘉宾的观点,不代表 FOLLOWME 的任何观点及立场,且不代表 FOLLOWME 同意其说法或描述,也不构成任何投资建议。对于访问者根据 FOLLOWME 社区提供的信息所做出的一切行为,除非另有明确的书面承诺文件,否则本社区不承担任何形式的责任。
FOLLOWME 交易社区网址: www.followme.ceo


加载失败()