| Scenario | |
|---|---|
| Timeframe | Weekly |
| Recommendation | BUY STOP |
| Entry Point | 0.5380 |
| Take Profit | 0.5859, 0.6348 |
| Stop Loss | 0.5120 |
| Key Levels | 0.4300, 0.4639, 0.5020, 0.5371, 0.5859, 0.6348 |
| Alternative scenario | |
|---|---|
| Recommendation | SELL STOP |
| Entry Point | 0.5010 |
| Take Profit | 0.4639, 0.4300 |
| Stop Loss | 0.5260 |
| Key Levels | 0.4300, 0.4639, 0.5020, 0.5371, 0.5859, 0.6348 |
Current trend
This week, the XRP/USD pair attempted to grow, rising to the 0.5300 area, but has since lost all its gains.
Unlike most leading crypto assets, the XRP token’s growth is being held back by the uncertainty caused by the ongoing litigation initiated by the US Securities and Exchange Commission (SEC) against Ripple. The technology company recently tried again to appeal the ruling recognizing the XRP token as a security at the stage of direct sales to institutional investors and imposing a fine of 125.0 million dollars on it. Lawyers argue that the Howey test, which is used to qualify the transaction as an investment contract, was incorrectly applied.
Ripple will likely only be able to resolve the lawsuits if there is a change in the White House administration, at least according to the company's founder Brad Garlinghouse, who told CNBC last week that the “time of terror” against cryptocurrencies will end after the presidential election. Many other experts share the same opinion: they hope that if Republican candidate Donald Trump returns to the White House, the SEC will have officials more loyal to digital assets, which will allow it to receive permission to launch a Ripple ETF, which was previously applied for by Canary Capital and Bitwise.
Overall, the fundamental background for the XRP/USD pair remains complex, with significant price gains expected after the US presidential race concludes.
Support and resistance
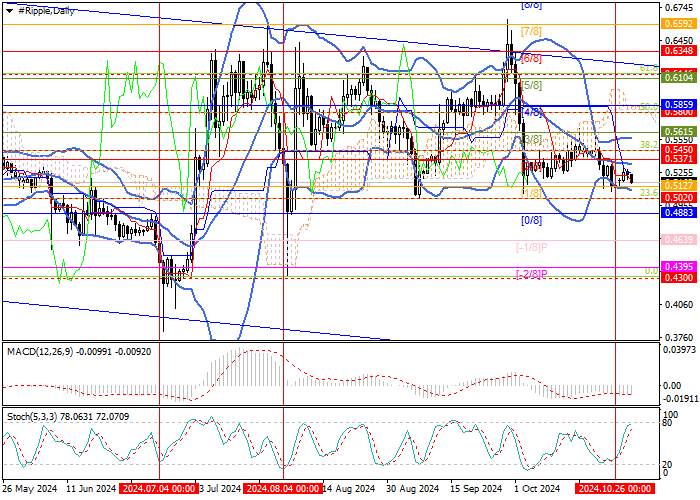
The asset is trading within the medium-term sideways range of 0.6348–0.5020 (Murrey level [6/8], 23.6% Fibonacci retracement) and now the price is at its lower border, consolidation below which may cause a further decline to the targets of 0.4639 (Murrey level [˗1/8]) and 0.4300 (the area of the July lows). If the 0.5371 mark (Murrey level [2/8], the central line of Bollinger Bands) is broken out, growth may resume to the targets of 0.5859 (Murrey level [4/8]) and 0.6348 (Murrey level [6/8]).
Technical indicators do not give a clear signal, illustrating the uncertainty of the market: Bollinger Bands are horizontal, MACD is stable in the negative zone, and Stochastic is directed upwards.
Resistance levels: 0.5371, 0.5859, 0.6348.
Support levels: 0.5020, 0.4639, 0.4300.

Trading tips
Long positions can be opened when the price consolidates above 0.5371 with targets at 0.5859, 0.6348 and a stop-loss at 0.5120. Implementation period: 5–7 days.
Short positions can be opened below 0.5020 with targets at 0.4639, 0.4300 and a stop-loss at 0.5260.
风险提示:以上内容仅代表作者或嘉宾的观点,不代表 FOLLOWME 的任何观点及立场,且不代表 FOLLOWME 同意其说法或描述,也不构成任何投资建议。对于访问者根据 FOLLOWME 社区提供的信息所做出的一切行为,除非另有明确的书面承诺文件,否则本社区不承担任何形式的责任。
FOLLOWME 交易社区网址: www.followme.ceo


加载失败()