
| Scenario | |
|---|---|
| Timeframe | Weekly |
| Recommendation | SELL STOP |
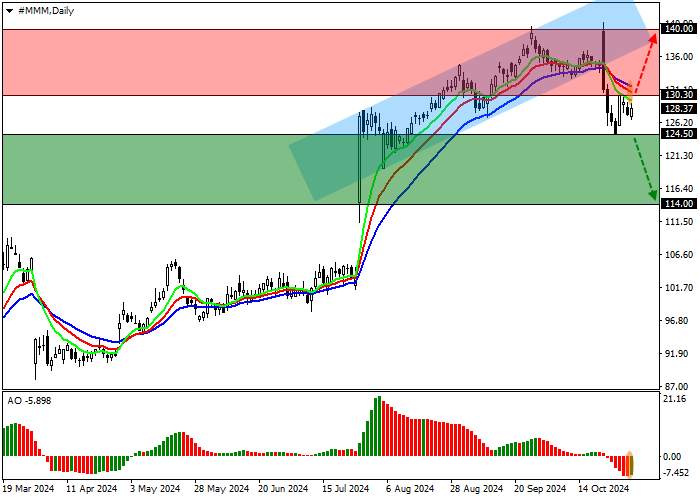
| Entry Point | 124.50 |
| Take Profit | 114.00 |
| Stop Loss | 128.00 |
| Key Levels | 115.00, 125.00, 128.00, 132.00, 140.00, 142.00 |
| Alternative scenario | |
|---|---|
| Recommendation | BUY STOP |
| Entry Point | 130.30 |
| Take Profit | 140.00 |
| Stop Loss | 126.00 |
| Key Levels | 115.00, 125.00, 128.00, 132.00, 140.00, 142.00 |
Shares of 3M Co., an American diversified innovation and manufacturing company, are trading in an uptrend at 128.00.
On the daily chart, the price is moving within a downward trend below the support line of the ascending channel with dynamic boundaries of 142.00–125.00.
On the four-hour chart, the quotes left the range sharply, breaking through the support line of 132.00, indicating a high probability of further decline. After forming the low, the asset corrected upwards. However, now it is preparing to reverse and test the level of 124.00. After a breakdown, it may reach the level of 115.00.
Technical indicators are holding a sell signal: fast EMAs on the Alligator indicator are below the signal line, holding a narrow range of fluctuations, and the AO histogram is forming correction bars in the sell zone.
Trading tips
Short positions may be opened after the price declines and consolidates below 124.50, with the target at 114.00. Stop loss — 128.00. Implementation period: 7 days or more.
Long positions may be opened after the price grows and consolidates above 130.30, with the target at 140.00. Stop loss — 126.00.
风险提示:本文所述仅代表作者个人观点,不代表 Followme 的官方立场。Followme 不对内容的准确性、完整性或可靠性作出任何保证,对于基于该内容所采取的任何行为,不承担任何责任,除非另有书面明确说明。


加载失败()