| Scenario | |
|---|---|
| Timeframe | Weekly |
| Recommendation | SELL STOP |
| Entry Point | 0.8605 |
| Take Profit | 0.8537, 0.8469, 0.8401 |
| Stop Loss | 0.8653 |
| Key Levels | 0.8401, 0.8469, 0.8537, 0.8606, 0.8700, 0.8761, 0.8851, 0.8922 |
| Alternative scenario | |
|---|---|
| Recommendation | BUY STOP |
| Entry Point | 0.8705 |
| Take Profit | 0.8761, 0.8851, 0.8922 |
| Stop Loss | 0.8653 |
| Key Levels | 0.8401, 0.8469, 0.8537, 0.8606, 0.8700, 0.8761, 0.8851, 0.8922 |
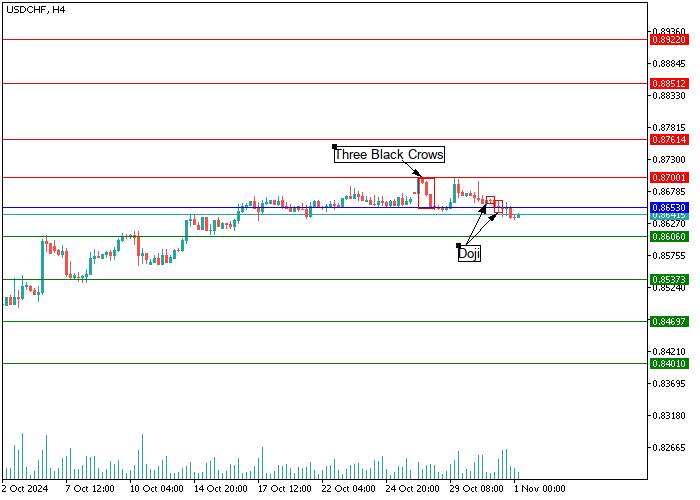
USD/CHF, H4
On the four-hour chart, they are trading in the area of 0.8641, holding for a long time in the range of 0.8606–0.8700 and forming a series of Doji candlestick analysis patterns, which confirm the continuing uncertainty in the market. It should also be noted that previously, in the area of the resistance level of 0.8700, a Three Black Crows pattern was formed, which signals increasing pressure on the price from sellers. Most likely, the instrument will continue to correct towards the key support level of 0.8606, the overcoming of which with increased trading volumes could become a catalyst for opening short positions with targets of 0.8537–0.8401. An alternative scenario is possible if the "bulls" manage to consolidate their positions above the resistance level of 0.8700, and then one can expect an increase in positive dynamics in the area of 0.8761–0.8922.

USD/CHF, D1
On the daily chart, the instrument's quotes are moving within a major downward trend, trading near the upper border and forming a "bearish" reversal pattern Tweezers Top near the resistance level of 0.8700, which warns market participants about the growing strength of the "bears" in the market. It should also be emphasized that earlier, on the price chart at the support level of 0.8606, a Bearish Engulfing pattern appeared, which warned about the increase in the influence of sellers in advance. Most likely, quotes will continue to adjust to the support level of 0.8606 in the near future, and if the price successfully consolidates below this key mark, one should expect an increase in negative dynamics in the area of 0.8537–0.8401.

Support and resistance
Support levels: 0.8606, 0.8537, 0.8469, 0.8401.
Resistance levels: 0.8700, 0.8761, 0.8851, 0.8922.
Trading tips
Short positions can be opened below the level of 0.8606 with targets at 0.8537, 0.8469, 0.8401. Stop-loss — 0.8653. Implementation time: 9-12 days.
Long positions can be opened above the level of 0.8700 with targets of 0.8761, 0.8851, 0.8922. Stop-loss — 0.8653.
风险提示:以上内容仅代表作者或嘉宾的观点,不代表 FOLLOWME 的任何观点及立场,且不代表 FOLLOWME 同意其说法或描述,也不构成任何投资建议。对于访问者根据 FOLLOWME 社区提供的信息所做出的一切行为,除非另有明确的书面承诺文件,否则本社区不承担任何形式的责任。
FOLLOWME 交易社区网址: www.followme.ceo


加载失败()