| Scenario | |
|---|---|
| Timeframe | Weekly |
| Recommendation | BUY STOP |
| Entry Point | 58.65 |
| Take Profit | 62.50, 65.62 |
| Stop Loss | 56.20 |
| Key Levels | 43.75, 46.88, 50.00, 53.12, 62.50, 65.62 |
| Alternative scenario | |
|---|---|
| Recommendation | SELL STOP |
| Entry Point | 53.10 |
| Take Profit | 50.00, 46.88, 43.75 |
| Stop Loss | 55.25 |
| Key Levels | 43.75, 46.88, 50.00, 53.12, 62.50, 65.62 |
Current trend
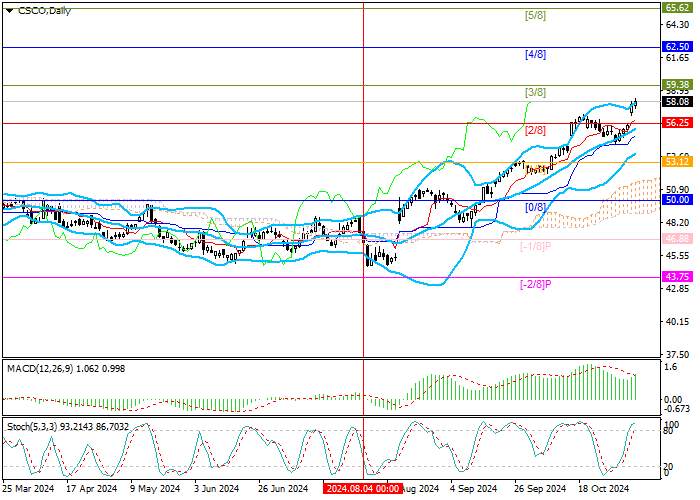
Shares of Cisco Systems Inc., an American manufacturer and supplier of network equipment for large holdings and telecommunications companies, have been moving within an upward trend for the fourth month. Now, the price has consolidated above the middle line of Bollinger Bands 56.25 (Murrey level [3/8]). It allows the price to reach the central mark of the Murrey trading range of 62.50 (Murrey level [4/8]) and the area of 65.62 (Murrey level [5/8]). In case of consolidation below the lower line of Bollinger Bands 53.12 (Murrey level [1/8]), a decline to targets of 50.00 (Murrey level [8/8]), 46.88 (Murrey level [–1/8]), and 43.75 (Murrey level [–2/8]) may follow.
Technical indicators confirm the continuation of the upward trend. Bollinger Bands and Stochastic are directed upward, although the latter has entered the overbought zone, and the MACD histogram is increasing in the positive zone.
Support and resistance
Resistance levels: 62.50, 65.62.
Support levels: 53.12, 50.00, 46.88, 43.75.

Trading tips
Long positions may be opened from 58.60, with the targets at 62.50, 65.62, and stop loss 56.20. Implementation period: 5–7 days.
Short positions may be opened below 53.12, with the targets at 50.00, 46.88, 43.75, and stop loss 55.25.
风险提示:本文所述仅代表作者个人观点,不代表 Followme 的官方立场。Followme 不对内容的准确性、完整性或可靠性作出任何保证,对于基于该内容所采取的任何行为,不承担任何责任,除非另有书面明确说明。


加载失败()