
| Scenario | |
|---|---|
| Time frame | Weekly |
| Recommendation | BUY STOP |
| Entry point | 507.00 |
| Take Profit | 537.00 |
| Stop Loss | 500.00 |
| The most important levels | 452.00, 485.00, 494.00, 507.00, 510.00, 537.00, 590.00 |
| Alternative scenario | |
|---|---|
| Recommendation | SELL-STOP |
| Entry point | 486.00 |
| Take Profit | 452.00 |
| Stop Loss | 495.00 |
| The most important levels | 452.00, 485.00, 494.00, 507.00, 510.00, 537.00, 590.00 |
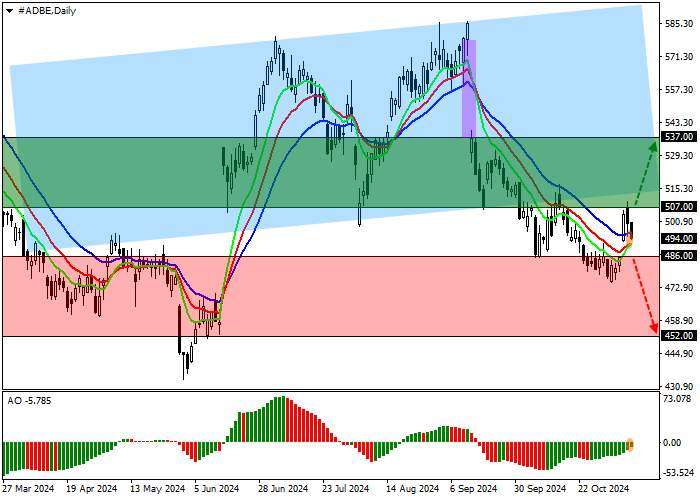
Shares of Adobe Inc., a leading American software producer, are in a corrective trend at 494.00.
On the daily chart, the price is approaching the support line of the wide ascending channel with the dynamic boundaries of 590.00-510.00 to test it again.
On the 4-hour chart, prices have broken through the October 7 low of 485.00, and consolidation above the high of 510.00 will allow them to reach the 540.00 area, but a reversal and a decline to the November 1 low of 475.00 is not ruled out.
Technical indicators are ready to give a buy signal: the EMA fluctuation range on the Alligator indicator is narrowing in the upward direction, and the AO histogram is forming rising bars in the sell zone.
Trading scenarios
Long positions can be opened after the price rises and stops above the level of 507.00 with a target of 537.00. Stop-loss — 500.00. Execution time: 7 days and more.
Short positions can be opened after the price falls and stops below the level of 486.00 with a target of 452.00. Stop-loss — 495.00.
风险提示:本文所述仅代表作者个人观点,不代表 Followme 的官方立场。Followme 不对内容的准确性、完整性或可靠性作出任何保证,对于基于该内容所采取的任何行为,不承担任何责任,除非另有书面明确说明。


加载失败()