| Scenario | |
|---|---|
| Timeframe | Weekly |
| Recommendations | BUY STOP |
| Entry point | 2705.0 |
| Take Profit | 2810.0 |
| Stop Loss | 2650.0 |
| Key levels | 2550.0, 2550.0, 2705.0, 2810.0 |
| Alternative scenario | |
|---|---|
| Recommendations | SELL STOP |
| Entry point | 2640.0 |
| Take Profit | 2550.0 |
| Stop Loss | 2700.0 |
| Key levels | 2550.0, 2550.0, 2705.0, 2810.0 |
Current dynamics
The XAU/USD pair retreated from the 2800.00 level amid market volatility following Donald Trump's victory in the presidential election and the US Federal Reserve's -25 basis points interest rate adjustment, justified by the recovery of the labor market and inflation reaching the 2.0% target.
The decline in gold prices is confirmed by the growth in yields on leading bonds: the most popular 10-year US Treasuries are reaching the level of early July at 4.344%. If the regulator maintains its dovish rhetoric, metal prices will continue to strengthen: since the Chicago Mercantile Exchange (CME) FedWatch Tool reflects the probability of a change in the cost of borrowing in December by -25 basis points, amounting to 64.9%, the current downward trend in the XAU/USD pair does not look sustainable. The long-term dynamics of the asset are influenced by expectations of the implementation of the election program by the administration of new US President Donald Trump, which includes a revision of import tariffs, which may cause an acceleration of inflation, against which safe-haven assets such as gold will receive support.
A significant increase in demand for the asset is confirmed by data from the Chicago Mercantile Exchange (CME Group): since November 6, the volume of trading in gold contracts reached a peak of 611.0 thousand, after which it dropped slightly to the current 394.0 thousand, which is much higher than the average value of last month of 290.0-310.0 thousand.
Support and resistance levels
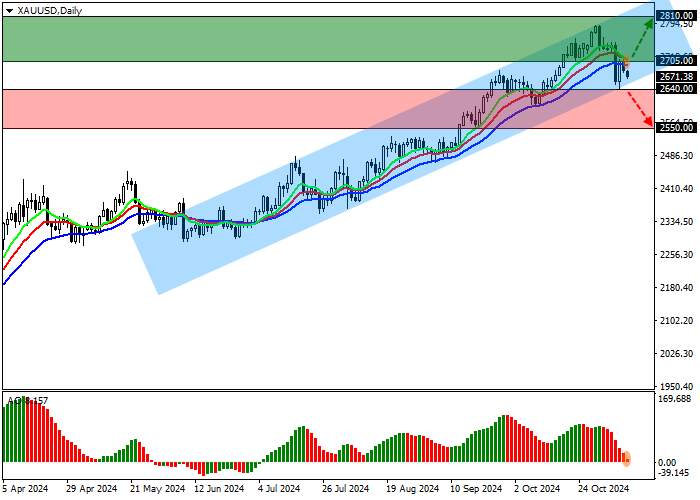
On the daily chart, the trading instrument is correcting above the support line of the long-term ascending channel 2820.0–2650.0.
Technical indicators weaken the buy signal: fast EMAs on the Alligator indicator are above the signal line, and the AO histogram forms correction bars above the transition level.
Resistance levels: 2705.0, 2810.0.
Support levels: 2640.0, 2550.0.

Trading scenarios
Long positions can be opened after the price grows and consolidates above the level of 2705.0 with the target of 2810.0. Stop loss is 2650.0. Implementation period: 7 days or more.
Short positions can be opened after the price declines and consolidates below 2640.0 with a target of 2550.0. Stop loss is 2700.0.
风险提示:本文所述仅代表作者个人观点,不代表 Followme 的官方立场。Followme 不对内容的准确性、完整性或可靠性作出任何保证,对于基于该内容所采取的任何行为,不承担任何责任,除非另有书面明确说明。


加载失败()