
| Scenario | |
|---|---|
| Timeframe | Weekly |
| Recommendation | BUY STOP |
| Entry Point | 183.50 |
| Take Profit | 193.00 |
| Stop Loss | 180.00 |
| Key Levels | 170.00, 172.00, 180.00, 181.00, 183.00, 193.00 |
| Alternative scenario | |
|---|---|
| Recommendation | SELL STOP |
| Entry Point | 179.00 |
| Take Profit | 169.00 |
| Stop Loss | 183.00 |
| Key Levels | 170.00, 172.00, 180.00, 181.00, 183.00, 193.00 |
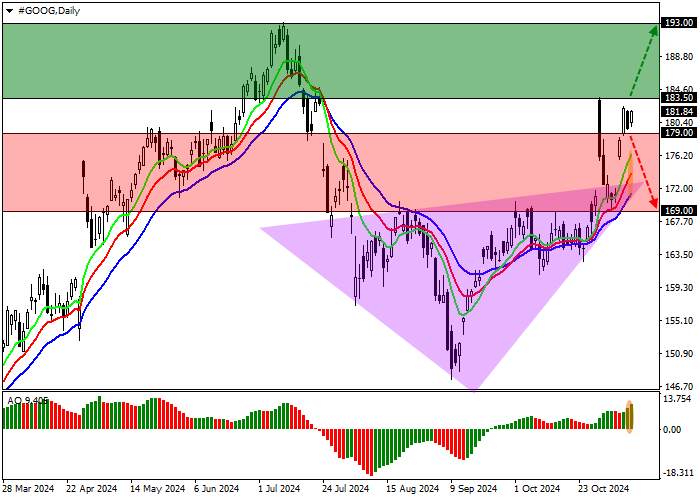
Shares of the American holding Alphabet Inc. are trading at 181.00.
A global correction trend is forming on the daily chart, within which the price is trying to retreat from the recently broken Head and shoulders pattern with the Neckline at 172.00.
On the four-hour chart, the quotes are approaching the high of October 30 at 183.00. A consolidation above will allow them to reach the year’s high of 193.00. Otherwise, the decline will continue to the pattern’s Neckline at 170.00.
Technical indicators are strengthening the buy signal: fast EMAs on the Alligator indicator are moving away from the signal line, and the AO histogram is forming ascending bars above the transition level.
Trading tips
Long positions may be opened after the price rises and consolidates above 183.50, with the target at 193.00. Stop loss is below 180.00. Implementation period: 7 days or more.
Short positions may be opened after the price falls and consolidates below 179.00, with the target at 169.00. Stop loss is 183.00.
风险提示:本文所述仅代表作者个人观点,不代表 Followme 的官方立场。Followme 不对内容的准确性、完整性或可靠性作出任何保证,对于基于该内容所采取的任何行为,不承担任何责任,除非另有书面明确说明。


加载失败()