
Scenario Timeframe Weekly Recommendation BUY STOP Entry Point 62.55 Take Profit 65.62, 68.75 Stop Loss 60.40 Key Levels 53.12, 56.25, 59.38, 62.50, 65.62, 68.75
Alternative scenario Recommendation SELL STOP Entry Point 59.35 Take Profit 56.25, 53.12 Stop Loss 61.80 Key Levels 53.12, 56.25, 59.38, 62.50, 65.62, 68.75
Current trend
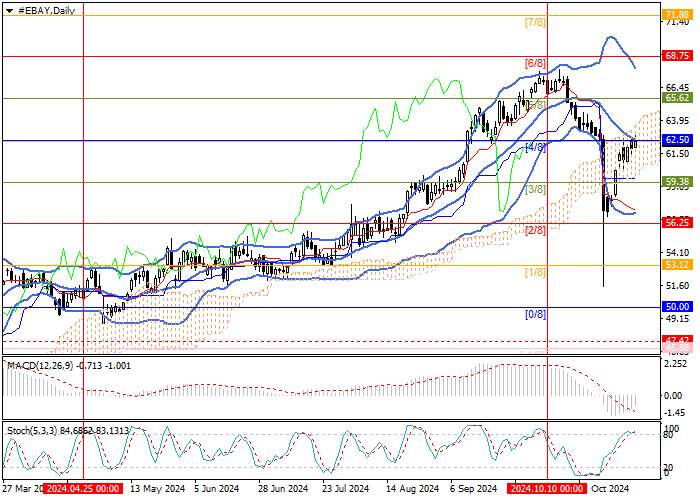
Since the beginning of the month, shares of eBay Inc., an American online retail company, have resumed growth within the upward trend and reached the central mark of the Murrey trading range of 62.50 (Murrey level [4/8]), supported by the middle line of Bollinger Bands, after breaking through which the movement will continue to the area of 65.62 (Murrey level [5/8]) and 68.75 (Murrey level [6/8]). In case of a breakdown of 59.38 (Murrey level [3/8]), the quotes will likely test the targets of 56.25 (Murrey level [2/8]) and 53.12 (Murrey level [1/8]).
Technical indicators do not give a single signal: Bollinger Bands are reversing downwards, the MACD histogram is decreasing in the negative zone, and Stochastic has entered the overbought zone, not excluding a downward reversal.
Support and resistance
Resistance levels: 62.50, 65.62, 68.75.
Support levels: 59.38, 56.25, 53.12.
Trading tips
Long positions may be opened above 62.50, with the targets at 65.62, 68.75, and stop loss 60.40. Implementation period: 5–7 days.
Short positions may be opened below 59.38, with the targets at 56.25, 53.12, and stop loss 61.80.
| Scenario | |
|---|---|
| Timeframe | Weekly |
| Recommendation | BUY STOP |
| Entry Point | 62.55 |
| Take Profit | 65.62, 68.75 |
| Stop Loss | 60.40 |
| Key Levels | 53.12, 56.25, 59.38, 62.50, 65.62, 68.75 |
| Alternative scenario | |
|---|---|
| Recommendation | SELL STOP |
| Entry Point | 59.35 |
| Take Profit | 56.25, 53.12 |
| Stop Loss | 61.80 |
| Key Levels | 53.12, 56.25, 59.38, 62.50, 65.62, 68.75 |
Current trend
Since the beginning of the month, shares of eBay Inc., an American online retail company, have resumed growth within the upward trend and reached the central mark of the Murrey trading range of 62.50 (Murrey level [4/8]), supported by the middle line of Bollinger Bands, after breaking through which the movement will continue to the area of 65.62 (Murrey level [5/8]) and 68.75 (Murrey level [6/8]). In case of a breakdown of 59.38 (Murrey level [3/8]), the quotes will likely test the targets of 56.25 (Murrey level [2/8]) and 53.12 (Murrey level [1/8]).
Technical indicators do not give a single signal: Bollinger Bands are reversing downwards, the MACD histogram is decreasing in the negative zone, and Stochastic has entered the overbought zone, not excluding a downward reversal.
Support and resistance
Resistance levels: 62.50, 65.62, 68.75.
Support levels: 59.38, 56.25, 53.12.
Trading tips
Long positions may be opened above 62.50, with the targets at 65.62, 68.75, and stop loss 60.40. Implementation period: 5–7 days.
Short positions may be opened below 59.38, with the targets at 56.25, 53.12, and stop loss 61.80.
风险提示:本文所述仅代表作者个人观点,不代表 Followme 的官方立场。Followme 不对内容的准确性、完整性或可靠性作出任何保证,对于基于该内容所采取的任何行为,不承担任何责任,除非另有书面明确说明。


暂无评论,立马抢沙发