
| Scenario | |
|---|---|
| Timeframe | Weekly |
| Recommendation | SELL STOP |
| Entry Point | 39.70 |
| Take Profit | 34.80 |
| Stop Loss | 43.00 |
| Key Levels | 35.00, 39.50, 40.00, 41.00, 42.70, 43.00, 47.00, 47.60 |
| Alternative scenario | |
|---|---|
| Recommendation | BUY STOP |
| Entry Point | 42.70 |
| Take Profit | 47.60 |
| Stop Loss | 40.00 |
| Key Levels | 35.00, 39.50, 40.00, 41.00, 42.70, 43.00, 47.00, 47.60 |
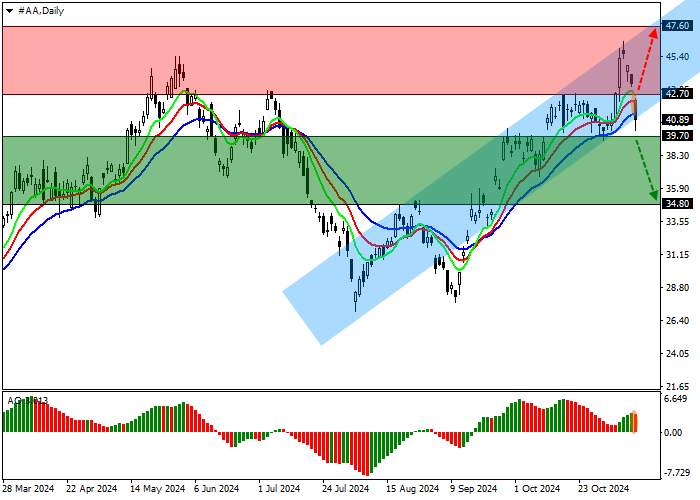
Shares of Alcoa Corp., one of the largest aluminum producers, are correcting at 41.00.
On the daily chart, the price retreats from the resistance line of the ascending channel with dynamic boundaries of 47.00–41.00 and tests its support level.
On the four-hour chart, the quotes’ exit from the range with the breakdown of the support level 40.00 confirms the probability of further decline. The asset is approaching the low of the end of October at 39.50. After consolidation below, it may reach 35.00.
Technical indicators maintain an unstable buy signal: the EMA fluctuation range on the Alligator indicator is narrowing downwards, and the AO histogram is forming downward bars in the buy zone.
Trading tips
Short positions may be opened after the price declines and consolidates below the 39.70 level, with the target at 34.80. Stop loss is around 43.00. Implementation period: 7 days or more.
Long positions may be opened after the price grows and consolidates above 42.70, with the target at 47.60. Stop loss — 40.00.
风险提示:本文所述仅代表作者个人观点,不代表 Followme 的官方立场。Followme 不对内容的准确性、完整性或可靠性作出任何保证,对于基于该内容所采取的任何行为,不承担任何责任,除非另有书面明确说明。


加载失败()