
| situation | |
|---|---|
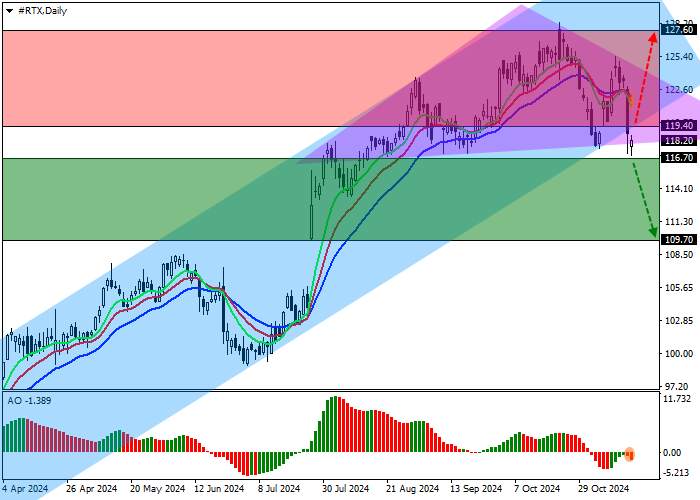
| Time frame | Weekly |
| Introduction | SELL STOP |
| Entry point | 116.70 |
| Make Profit | 109.70 |
| Stop Loss | 120.00 |
| Key Levels | 105.10, 109.70, 116.70, 118.00, 120.00, 127.60, 133.00 |
| Alternative scenarios | |
|---|---|
| Introduction | BUY STOP |
| Entry point | 119.40 |
| Make Profit | 127.60 |
| Stop Loss | 116.00 |
| Key Levels | 105.10, 109.70, 116.70, 118.00, 120.00, 127.60, 133.00 |
Shares of RTX Corp., an American aerospace and defense conglomerate, are trading at $118.00.
On the daily chart, the price is adjusting from the support line of the ascending channel, with a range of 133.00–118.00.
On the four-hour chart, if the price breaks out of the head and shoulders reversal pattern with the neckline at 118.00, a downtrend is likely to occur. After the onset of the pattern, the main obstacle to the decline will remain at the end of the price gap at 109.70–105.10.
Technical indicators are preparing to reinforce the sell signal: the fast EMA on the Alligator indicator begins to move away from the signal line, and the AO histogram is forming bars in the negative zone.
Trading Tips
Short positions can be opened after the price drops and consolidates below 116.70 with a target of 109.70. Stop loss — 120.00. Execution period: 7 days or more.
Long positions can be opened after the price increases and consolidates above 119.40 with a target of 127.60 stop loss — 116.00.
风险提示:本文所述仅代表作者个人观点,不代表 Followme 的官方立场。Followme 不对内容的准确性、完整性或可靠性作出任何保证,对于基于该内容所采取的任何行为,不承担任何责任,除非另有书面明确说明。


加载失败()