
| Scenario | |
|---|---|
| Timeframe | Weekly |
| Recommendations | BUY STOP |
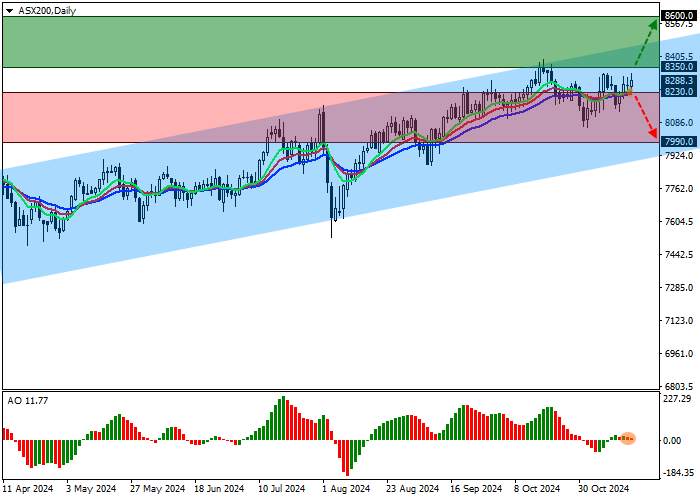
| Entry point | 8350.0 |
| Take Profit | 8600.0 |
| Stop Loss | 8200.0 |
| Key levels | 7990.0, 8230.0, 8350.0, 8600.0 |
| Alternative scenario | |
|---|---|
| Recommendations | SELL STOP |
| Entry point | 8230.0 |
| Take Profit | 7990.0 |
| Stop Loss | 8300.0 |
| Key levels | 7990.0, 8230.0, 8350.0, 8600.0 |
Current dynamics
Australia's leading ASX 200 index is trading unsteadily near 8283.0 amid mixed earnings from its component companies.
The Commonwealth Bank of Australia is set to report its results today, with revenue expected to be A$6.80 billion, up from A$6.68 billion in the prior-year period and roughly the same as A$6.82 billion in the same period a year earlier. National Australia Bank Ltd., meanwhile, is expected to report revenue of A$10.127 billion, up from A$10.403 billion reported earlier. Also scheduled today is Wesfarmers Ltd., a chemicals and fertiliser retailer, with revenue expected to be A$7.267 billion, up from A$6.880 billion last year.
Amid relatively stable monetary policy from the Reserve Bank of Australia (RBA), yields on leading bonds are rising, putting pressure on the index: the 10-year Treasury rate rose to 4.654%, the highest since early November 2023, reflecting investors' desire to temporarily move out of real assets in favor of safer bonds, the 20-year bond rate rose to 5.073% from 5.023%, and the 30-year rate rose to 5.089%, the highest since early October 2023.
The growth leaders in the index are South32 Ltd. ( 6.20%), Mineral Resources Ltd. ( 5.76%), Omni Bridgeway Ltd. ( 3.41%), Incitec Pivot Ltd. ( 3.96%).
Among the leaders of the decline are Appen Ltd. (-6.91%), Resolute Mining (-5.59%), Zip Co Ltd. (-3.27%).
Support and resistance levels
On the daily chart, the price is holding just below the resistance line of the ascending channel with dynamic boundaries of 8500.0–7920.0, confidently approaching it.
Technical indicators have recently turned around and are maintaining a new buy signal: the fast EMAs of the Alligator indicator are moving away from the signal line, and the AO histogram is forming correction bars, while remaining above the transition level.
Support levels: 8230.0, 7990.0.
Resistance levels: 8350.0, 8600.0.
Trading scenarios
In case of continued growth and consolidation of the price above the resistance level of 8350.0, positions for purchase with a target of 8600.0 and a stop-loss of 8200.0 will be relevant. Implementation period: 7 days or more.
In case of a reversal and continued price decline with consolidation below the 8230.0 mark, sell positions with a target of 7990.0 will be relevant. Stop loss - 8300.0.
风险提示:以上内容仅代表作者或嘉宾的观点,不代表 FOLLOWME 的任何观点及立场,且不代表 FOLLOWME 同意其说法或描述,也不构成任何投资建议。对于访问者根据 FOLLOWME 社区提供的信息所做出的一切行为,除非另有明确的书面承诺文件,否则本社区不承担任何形式的责任。
FOLLOWME 交易社区网址: www.followme.ceo


加载失败()