
| Scenario | |
|---|---|
| Timeframe | Weekly |
| Recommendation | SELL STOP |
| Entry Point | 60.20 |
| Take Profit | 56.00 |
| Stop Loss | 62.00 |
| Key Levels | 56.00, 57.00, 60.20, 61.00, 62.54, 67.00, 67.20, 68.00 |
| Alternative scenario | |
|---|---|
| Recommendation | BUY STOP |
| Entry Point | 62.60 |
| Take Profit | 67.20 |
| Stop Loss | 60.00 |
| Key Levels | 56.00, 57.00, 60.20, 61.00, 62.54, 67.00, 67.20, 68.00 |
Shares of eBay Inc., an American online retail company, are correcting at 61.00.
On the daily chart, the price is forming a positive trend, trying to stay above the support line of the ascending channel 68.00–56.00.
On the four-hour chart, the decline, which began after the price gap of 62.54–57.13 was covered, is aimed at a full exit of the quotes from the long-term range. After consolidation below the support level of 60.00, the target of 57.00 is relevant. In the case of holding the support line, a reversal and growth with the renewal of the year’s highs of 67.00 are expected.
Technical indicators are strengthening the sell signal: fast EMAs on the Alligator indicator are below the signal line, and the AO histogram is forming downward bars in the sell zone.
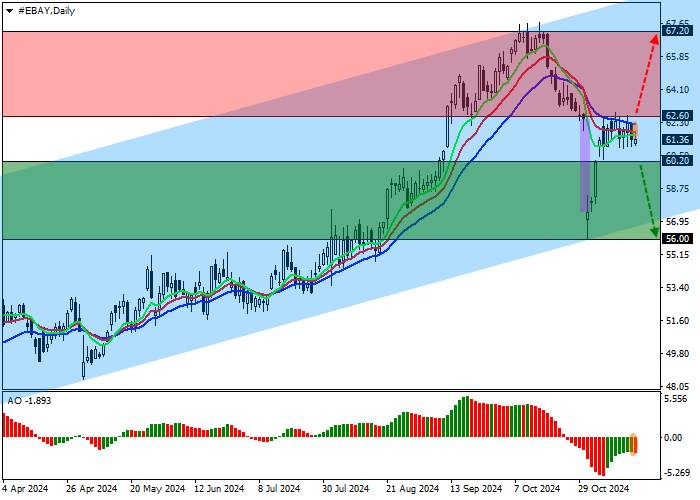
Trading tips
Short positions may be opened after the price consolidates below 60.20, with the target at 56.00. Stop loss is slightly above 62.00. Implementation period: 7 days or more.
Long positions may be opened after the price grows and consolidates above 62.60, with the target at 67.20 and stop loss 60.00.
风险提示:本文所述仅代表作者个人观点,不代表 Followme 的官方立场。Followme 不对内容的准确性、完整性或可靠性作出任何保证,对于基于该内容所采取的任何行为,不承担任何责任,除非另有书面明确说明。


加载失败()