| Scenario | |
|---|---|
| Timeframe | Intraday |
| Recommendations | SELL STOP |
| Entry point | 0.8825 |
| Take Profit | 0.8750 |
| Stop Loss | 0.8865 |
| Key levels | 0.8730, 0.8776, 0.8800, 0.8827, 0.8865, 0.8900, 0.8935, 0.8964 |
| Alternative scenario | |
|---|---|
| Recommendations | BUY STOP |
| Entry point | 0.8865 |
| Take Profit | 0.8935 |
| Stop Loss | 0.8827 |
| Key levels | 0.8730, 0.8776, 0.8800, 0.8827, 0.8865, 0.8900, 0.8935, 0.8964 |
Current dynamics
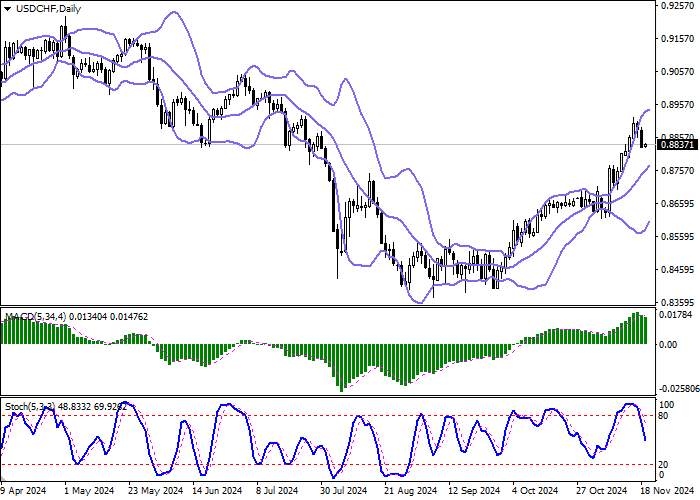
The USD/CHF pair is trading mixed, holding near the 0.8836 mark after a fairly aggressive decline the day before.
Investors took note of the sharp slowdown in industrial production in Switzerland in the third quarter from 7.0% to 3.5%. In addition, market participants assessed the inflation statistics that were published last Friday: the producer price index and imports in October lost 0.3% after -0.1% in the previous month, while analysts expected 0.1%, and in annual terms the negative dynamics increased to -1.8% from -1.3%.
On Friday, the US will release November business activity data, with manufacturing expected to rise slightly from 48.5 to 48.8 and services from 55.0 to 55.2. On the same day at 14:40 (GMT 2), the head of the Swiss National Bank, Martin Schlegel, who took office in October 2024, will speak.
Support and resistance levels
Bollinger Bands on the daily chart demonstrate confident growth: the price range is narrowing, reflecting the emergence of mixed trading dynamics in the ultra-short term. MACD has turned into a downward plane, forming a new sell signal (the histogram is located below the signal line). Stochastic demonstrates a more confident decline, but is currently located in the center of the working area, signaling in favor of further development of downward dynamics in the nearest time intervals.
Resistance levels: 0.8865, 0.8900, 0.8935, 0.8964.
Support levels: 0.8827, 0.8800, 0.8776, 0.8730.


Trading scenarios
Short positions can be opened after a confident breakout of the 0.8827 level downwards with a target of 0.8750. Stop loss is 0.8865. Implementation period: 2-3 days.
A rebound from the 0.8827 level as support followed by a breakout of the 0.8865 mark upwards may be a signal to open new long positions with a target of 0.8935. Stop loss is 0.8827.
风险提示:本文所述仅代表作者个人观点,不代表 Followme 的官方立场。Followme 不对内容的准确性、完整性或可靠性作出任何保证,对于基于该内容所采取的任何行为,不承担任何责任,除非另有书面明确说明。
FOLLOWME 交易社区网址: www.followme.ceo


加载失败()