| Scenario | |
|---|---|
| Timeframe | Intraday |
| Recommendation | BUY STOP |
| Entry Point | 1.0600 |
| Take Profit | 1.0700 |
| Stop Loss | 1.0550 |
| Key Levels | 1.0450, 1.0500, 1.0530, 1.0561, 1.0600, 1.0630, 1.0665, 1.0700 |
| Alternative scenario | |
|---|---|
| Recommendation | SELL STOP |
| Entry Point | 1.0560 |
| Take Profit | 1.0500 |
| Stop Loss | 1.0600 |
| Key Levels | 1.0450, 1.0500, 1.0530, 1.0561, 1.0600, 1.0630, 1.0665, 1.0700 |
Current trend
The EUR/USD pair is showing mixed trading, consolidating near 1.0590. Market activity remains quite high, but investors cannot decide on the direction of the trend after a fairly active corrective growth at the beginning of the current week.
The macroeconomic statistics from the EU published the day before failed to provide significant support to the single currency, which continues to remain close to local highs only against the backdrop of a weak dollar. The eurozone's Core Consumer Price Index rose another 0.2% month-on-month and 2.7% year-on-year in October, in line with forecasts, while the broader measure rose 0.3% and 2.0%, respectively. Thus, price pressure has stabilized around the target levels, which introduces some uncertainty into the further steps of the European Central Bank (ECB). In this regard, it is worth noting the comments of the Governor of the Bank of Italy, Fabio Panetta, who said the day before that the regulator should reduce the cost of borrowing in order to stimulate growth of the economy, which is on the verge of stagnation. Otherwise, he said, a scenario will arise in which inflation ends up significantly below the target, which will be difficult to counter with monetary policy adjustments.
Meanwhile, the US currency was pressured by macroeconomic data the day before: Building Permits issued in October fell by 0.600 million after increasing by 1.325 million in the previous month, while the markets were counting on 1.430 million, and Building Permits Change lost 0.6% after –3.1% a month earlier, while Housing Starts Change fell by 3.1% after –1.9% in September. Investors also took note of the Redbook Retail Sales Index, which accelerated from 4.8% to 5.1% in November. On Friday, the US and the eurozone will release November data on business activity in the manufacturing and services sectors from S&P Global.
Support and resistance
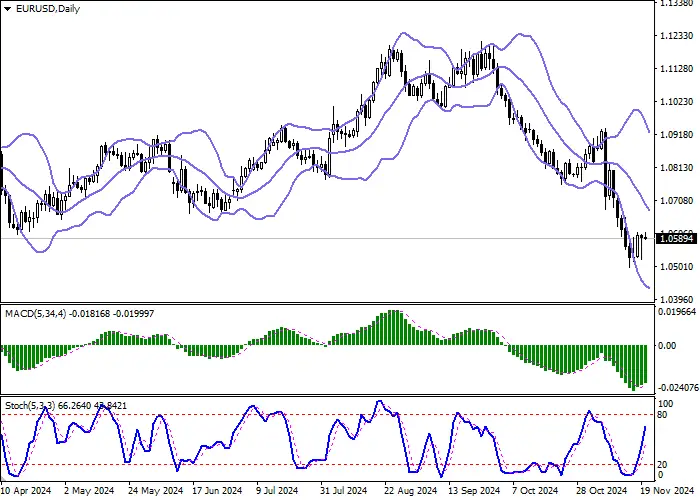
Bollinger Bands on the daily chart show a steady decline. The price range is narrowing, being spacious enough for the current activity level in the market. MACD grows, preserving a stable buy signal (located above the signal line). Stochastic grows more steadily but is rapidly approaching its highs, which reflects risks of the overbought euro in the ultra-short term.
Resistance levels: 1.0600, 1.0630, 1.0665, 1.0700.
Support levels: 1.0561, 1.0530, 1.0500, 1.0450.


Trading tips
Long positions can be opened after a breakout of 1.0600 with the target of 1.0700. Stop-loss — 1.0550. Implementation time: 2-3 days.
A rebound from 1.0600 as from resistance, followed by a breakdown of 1.0561 may become a signal for opening of new short positions with the target at 1.0500. Stop-loss — 1.0600.
风险提示:以上内容仅代表作者或嘉宾的观点,不代表 FOLLOWME 的任何观点及立场,且不代表 FOLLOWME 同意其说法或描述,也不构成任何投资建议。对于访问者根据 FOLLOWME 社区提供的信息所做出的一切行为,除非另有明确的书面承诺文件,否则本社区不承担任何形式的责任。
FOLLOWME 交易社区网址: www.followme.ceo

