| Scenario | |
|---|---|
| Timeframe | Weekly |
| Recommendations | BUY STOP |
| Entry point | 31.70 |
| Take Profit | 33.70 |
| Stop Loss | 31.00 |
| Key levels | 28.70, 30.70, 31.70, 33.70 |
| Alternative scenario | |
|---|---|
| Recommendations | SELL STOP |
| Entry point | 30.70 |
| Take Profit | 28.70 |
| Stop Loss | 31.40 |
| Key levels | 28.70, 30.70, 31.70, 33.70 |
Current dynamics
During the morning session, the XAG/USD pair is trading at 31.16 amid rising gold prices and rhetoric from US Federal Reserve officials.
The regulator plans to continue its easing cycle of monetary policy and adjust the interest rate by -25 basis points in December, which will support assets alternative to the dollar in the long term. As a result of the measures taken, the debt burden will gradually decrease, creating new opportunities for production growth, increasing demand for metals used in industry. Thus, according to forecasts of the Silver Institute, its consumption will reach 700.0 million ounces in 2024, which means an annual increase of more than 7.0%. On the other hand, according to data from the Chicago Mercantile Exchange (CME) FedWatch Tool, the probability of a 25 basis point reduction in borrowing costs in December has changed from 80.0% to 58.9% in two weeks, and closer to the meeting itself, investments in metals may grow amid uncertainty.
In yesterday's trading, the volume of demand for silver contracts amounted to 85.0 thousand, below the peak volumes of 150.0 thousand at the beginning of the month. The decrease also occurred in the option position, which yesterday reached 16.694 thousand compared to 45.365 thousand in the first week of November, which reflects investors' uncertainty about the continuation of growth.
Support and resistance levels
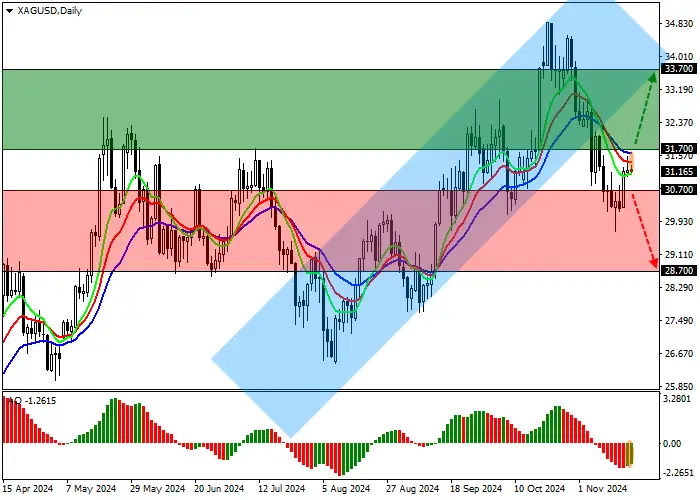
On the daily chart, the trading instrument is moving below the support line of the ascending channel with dynamic boundaries of 34.80–31.60, preparing to continue approaching it.
Technical indicators maintain a sell signal: the EMA oscillation range on the Alligator indicator is directed downwards, and the AO histogram forms correction bars, rising in the negative zone.
Resistance levels: 31.70, 33.70.
Support levels: 30.70, 28.70.

Trading scenarios
Long positions can be opened after the price grows and consolidates above 31.70 with a target of 33.70. Stop loss is 31.00. Implementation period: 7 days or more.
Short positions can be opened after the price declines and consolidates below 30.70 with a target of 28.70. Stop loss is 31.40.
风险提示:以上内容仅代表作者或嘉宾的观点,不代表 FOLLOWME 的任何观点及立场,且不代表 FOLLOWME 同意其说法或描述,也不构成任何投资建议。对于访问者根据 FOLLOWME 社区提供的信息所做出的一切行为,除非另有明确的书面承诺文件,否则本社区不承担任何形式的责任。
FOLLOWME 交易社区网址: www.followme.ceo

