| Scenario | |
|---|---|
| Timeframe | Weekly |
| Recommendations | BUY STOP |
| Entry point | 250.50 |
| Take Profit | 275.00, 300.00 |
| Stop Loss | 230.00 |
| Key levels | 150.00, 175.00, 200.00, 250.00, 275.00, 300.00 |
| Alternative scenario | |
|---|---|
| Recommendations | SELL STOP |
| Entry point | 199.80 |
| Take Profit | 175.00, 150.00 |
| Stop Loss | 218.00 |
| Key levels | 150.00, 175.00, 200.00, 250.00, 275.00, 300.00 |
Current dynamics
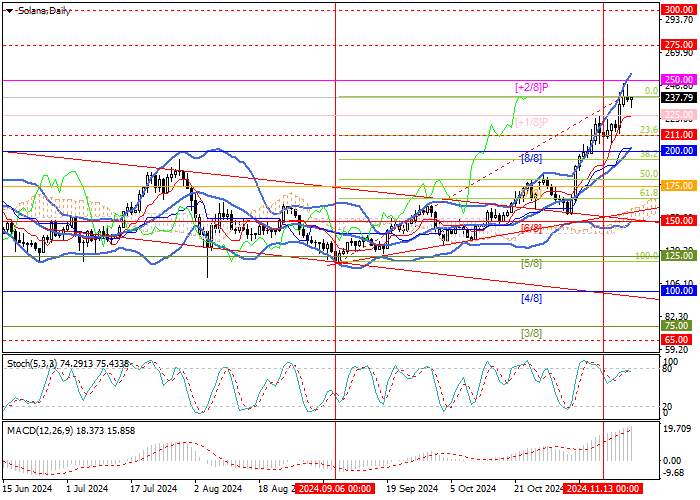
The SOL/USD pair has been actively increasing in value for the third month in a row: last week the price reached a yearly maximum of 248.40, after which it partially corrected downwards as investors took profits, and is now at the 236.00 mark.
The main support for the digital asset quotes is provided by the re-election of the Republican candidate Donald Trump as US President and the associated hopes for a more loyal attitude of the authorities to the cryptocurrency sector. Thus, according to Matthew Siegel, head of digital asset research at VanEck, the coming to power of the new administration will act as a driver for the approval of new exchange instruments by the US Securities and Exchange Commission (SEC). At the end of last week, he said that there is a high probability of the launch of spot ETFs based on Solana before the end of 2025. Siegel believes that during Donald Trump's presidency, institutional investments in SOL may grow significantly, supporting the token's position on the market.
Fundamental factors also provide additional support to the SOL/USD pair: according to the aggregator DefiLlama, last week the token had a record trading volume on decentralized exchanges (DEX) of 33.59% (about $41.2 billion). According to experts, this indicates an increase in its acceptance among investors. In these conditions, the resumption of the upward dynamics of the SOL/USD pair in the medium term seems to be the most likely scenario.
Support and resistance levels
The price is close to the 250.00 mark (Murray level [ 2/8]), a breakout of which will ensure continued growth to the targets of 275.00 and 300.00. The key support zone for the bears seems to be 211.00–200.00 (Fibonacci correction 23.6%, Murray level [8/8], middle line of Bollinger Bands), consolidation below which will allow continued movement to the area of 175.00 (Murray level [7/8]) and 150.00 (Murray level [6/8]).
Technical indicators confirm the continuation of the upward trend: Bollinger Bands are directed upwards, MACD is increasing in the positive zone, and Stochastic is horizontal near the overbought zone.
Resistance levels: 250.00, 275.00, 300.00.
Support levels: 200.00, 175.00, 150.00.

Trading scenarios
Long positions can be opened above the 250.00 mark with targets at 275.00, 300.00 and stop loss at 230.00. Implementation period: 5-7 days.
Short positions can be opened below the 200.00 mark with targets at 175.00, 150.00 and stop loss at 218.00.
风险提示:本文所述仅代表作者个人观点,不代表 Followme 的官方立场。Followme 不对内容的准确性、完整性或可靠性作出任何保证,对于基于该内容所采取的任何行为,不承担任何责任,除非另有书面明确说明。


加载失败()