
| scenario | |
|---|---|
| Time frame | Weekly |
| Recommendations | BUY STOP |
| Entry point | 23.20 |
| profit making | 24.50 |
| Stop loss | 22.70 |
| For main levels | 21.00, 22.50, 22.70, 23.00, 23.20, 24.00 |
| Alternative scenario | |
|---|---|
| Recommendations | SELL STOP |
| Entry point | 22.40 |
| profit making | 21.00 |
| Stop loss | 23.00 |
| For main levels | 21.00, 22.50, 22.70, 23.00, 23.20, 24.00 |
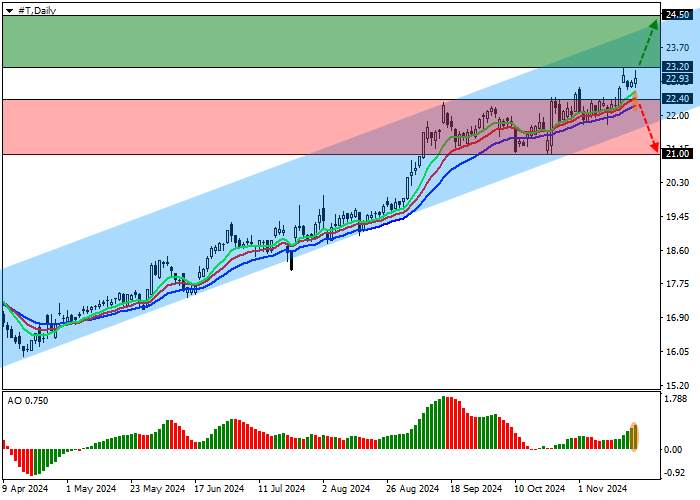
Shares of AT&T Inc., one of the largest US telecommunications companies, corrected at the 23.00 level.
On the daily chart, the price is approaching the resistance line of the ascending channel with dynamic boundaries 24.00-21.00.
On a four-hour timeframe, after holding above the high of 22.50, prices may reach the range resistance line at 24.50. In case of a reversal and decline and consolidation below the recent set of highs around 22.00, the asset will enter a correction phase with a target at the channel support level at 21.00.
Technical indicators maintain a stable buy signal: the fast EMA on the Alligator indicator is moving away from the signal line, and the AO histogram is forming bullish bars in the positive zone.
Trading Tips
Long positions can be opened after the price rises and fixes above the level of 23.20 with a target at 24.50. Stop loss - 22.70. Execution period: 7 days or more.
Short positions can be opened after the price falls and fixes below the level of 22.40 with a target at 21.00. Stop loss - 23.00.
风险提示:本文所述仅代表作者个人观点,不代表 Followme 的官方立场。Followme 不对内容的准确性、完整性或可靠性作出任何保证,对于基于该内容所采取的任何行为,不承担任何责任,除非另有书面明确说明。


加载失败()